Dive into supervised machine learning with these straightforward steps. Learn how to use models leveraging labeled data to make accurate predictions and classifications. Perfect for beginners looking to understand and implement supervised learning effectively.
Machine learning is important because it gives enterprises a view of trends in customer behavior and business operational patterns, as well as supports the development of new products. Many of today’s leading companies, such as Meta, Google, Netflix and Uber, make machine learning a central part of their operations. Machine learning has become a significant competitive differentiator for many companies.
What are common ways in which machines learn?
Classical machine learning is often categorizes algorithms in the way it learns and predicts accurately. There are four basic approaches: supervised learning, unsupervised learning, semi-supervised learning / self-supervised learning and reinforcement learning. The type of algorithm data scientists choose to use depends on what type of data they want to predict.
Supervised learning
In this type of machine learning, data scientists supply algorithms with labeled training data and define the variables they want the algorithm to assess for correlations. Both the input and the output of the algorithm is specified.
Unsupervised learning
This type of machine learning involves algorithms that train on unlabeled data. The algorithm scans through data sets looking for any meaningful connection. The data that algorithms train on are predetermined while the predictions or recommendations they output are learned from the data.
Semi-supervised learning
This approach to machine learning involves a mix of the two preceding types. Data scientists may feed an algorithm mostly labeled training data, but the model is free to explore the data on its own and develop its own understanding of the data set.
Reinforcement learning
Data scientists typically use reinforcement learning to teach a machine to complete a multi-step process for which there are clearly defined rules. Data scientists program an algorithm to complete a task and give it positive or negative cues as it works out how to complete a task. But for the most part, the algorithm decides on its own what steps to take along the way.
Introduction to supervised machine learning
Supervised machine learning is a type of artificial intelligence that trains algorithms on labeled data to make predictions or take actions based on input data. It involves a model learning from past observations and making predictions on new, unseen data. The goal is to develop a model that can generalize from the training data to unseen data.
Supervised machine learning is a subfield of artificial intelligence where a model is trained on labeled data to make predictions or take actions based on new input data. It uses algorithms that can learn from the data and improve their predictions over time. The labeled data used in supervised learning includes input features and corresponding output labels, allowing the algorithm to learn the relationship between the inputs and outputs. This learning process helps the algorithm make accurate predictions on new data it has not seen before.
Supervised learning is used in a wide range of applications, such as image classification, speech recognition, sentiment analysis, and predictive maintenance. The success of a supervised learning model depends on the quality and size of the training data, as well as the choice of algorithm. Common algorithms used in supervised learning include linear regression, logistic regression, decision trees, and neural networks.
What is supervised learning?
As the name suggests, supervised learning involves training a computer system using labeled data. This means that each piece of data comes with a known correct answer. The system learns from these examples to make predictions or classifications on new, unlabeled data. Essentially, the machine is taught using a set of training examples, which it uses to analyze and accurately predict outcomes for new data.
In this instance, we have pictures labeled as “spoon” or “knife”. The machine receives this known data and processes it to assess and learn the correlation of the images based on their characteristics, such as size, shape, sharpness, etc. Now, using the historical data, the machine can properly predict that a fresh image fed to it is a spoon based on its characteristics. Thus, the machine learns the things from training data and then applies the knowledge to test data.
Supervised machine learning requires the data scientist to train the algorithm with both labeled inputs and desired outputs. Supervised learning algorithms are good for the following tasks:
Binary classification: Dividing data into two categories.
Multi-class classification: Choosing between more than two types of answers.
Introduction to classification as a supervised learning technique
Classification is a type of supervised machine learning where the model is trained to predict a categorical output. The output can be one of several pre-defined classes. It’s used for problems like spam detection, sentiment analysis, and image classification. The model is trained to learn the relationship between input features and the output class, allowing it to make predictions for new data.
The variable to be predicted has two or more classes and is categorical, say, true or false, male or female, yes or no, etc.
For example, to determine if an email is spam, we first need to train the computer to recognize what spam looks like. This is done by using spam filters that analyze the email’s header and body for suspicious patterns. These filters look for specific keywords and check against known blacklists of banned spammers. Based on these factors, the email is assigned a spam score. A lower spam score indicates a lower likelihood of the email being spam. The algorithm then uses this score, along with the content and labels, to decide whether new incoming emails should be placed in the inbox or the spam folder.
Get started immediately with classification using KNN – python example with scikit learn
from sklearn.datasets import load_digits
from sklearn.model_selection import train_test_split
from sklearn.neighbors import KNeighborsClassifier
from sklearn.metrics import accuracy_score

# Load the digits dataset
digits = load_digits()
X = digits.data
y = digits.target

# Split the data into training and testing sets
X_train, X_test, y_train, y_test = train_test_split(X, y, test_size=0.3, random_state=42)

# Create and train the K-Nearest Neighbors classifier
model = KNeighborsClassifier()
model.fit(X_train, y_train)

# Make predictions
y_pred = model.predict(X_test)

# Evaluate the model
accuracy = accuracy_score(y_test, y_pred)
print(f"Accuracy: {accuracy:.2f}")
Introduction to regression as a supervised learning technique
Regression is a type of supervised machine learning that involves predicting a continuous output value. It’s used for problems like stock price prediction, housing price prediction, and weather prediction. The model is trained to learn the relationship between input features and the output value, allowing it to make predictions for new data.
The variable to be predicted is a real or continuous value. A change in one variable is related to a change in the other in this situation because there is a relationship between the two or more variables. For instance, regression can be used to predict the house price from training data that may include locality, size of a house, etc.
Regression example with simple explanation
Let’s take two variables: temperature and humidity. The independent variable in this situation is “temperature,” and the dependent variable is “humidity.” The humidity drops as the temperature rises.
The model is fed these two variables, and as a result, the computer learns how they relate to one another. Once trained, the system can accurately forecast the humidity depending on the temperature.
The following is another example of airfare vs distance.
Get started immediately with linear regression – python example with scikit learn
import numpy as np
from sklearn.datasets import load_diabetes
from sklearn.linear_model import LinearRegression
from sklearn.model_selection import train_test_split
from sklearn.metrics import mean_squared_error

# Load the diabetes dataset
diabetes = load_diabetes()
X = diabetes.data
y = diabetes.target

# Split the data into training and testing sets
X_train, X_test, y_train, y_test = train_test_split(X, y, test_size=0.2, random_state=42)

# Create and train the linear regression model
model = LinearRegression()
model.fit(X_train, y_train)

# Make predictions
y_pred = model.predict(X_test)

# Evaluate the model
mse = mean_squared_error(y_test, y_pred)
print(f"Mean Squared Error: {mse:.2f}")
Applications of supervised learning
Risk Assessment: In order to reduce the risk portfolio of the companies, supervised learning is used to analyze risk in the financial services or insurance domains.
Image classification: One of the primary use cases for showing supervised machine learning is image categorization. For instance, Facebook can identify your friend in a photo from a collection of tagged images.
Fraud Detection: To determine whether the user’s transactions are genuine or not.
Visual Recognition: The capacity of a machine learning model to recognize images, actions, places, people, and things.
Advantages: –
Supervised learning allows collecting data and produces data output from previous experiences.
Helps to optimize performance criteria with the help of experience.
Supervised machine learning helps to solve various types of real-world computation problems.
Disadvantages: –
Classifying big data can be challenging.
Training for supervised learning needs a lot of computation time. So, it requires a lot of time.
Classification and regression are two types of supervised machine learning that are used to solve different types of problems. In classification, the goal is to predict a categorical output, while in regression, the goal is to predict a continuous output. The choice between the two depends on the nature of the problem and the type of output required.
Classification and regression are two common types of supervised machine learning. The main difference between them is the type of output they predict.
Classification is a type of supervised machine learning that is used to predict a categorical output, such as a label or a class. The output can be one of several pre-defined classes, and the goal is to train a model that can accurately predict the class of new, unseen data. Examples of classification problems include image classification, spam detection, and sentiment analysis.
Regression, on the other hand, is used to predict a continuous output, such as a numerical value. The goal is to train a model that can accurately predict the value of a continuous target variable based on input features. Examples of regression problems include stock price prediction, housing price prediction, and weather prediction.
The choice between classification and regression depends on the nature of the problem and the type of output required. If the goal is to predict a categorical output, then classification is the appropriate technique. If the goal is to predict a continuous output, then regression is the appropriate technique.
How to decide when to use regression or classification models?
Aspect
Regression Models
Classification Models
Objective
Predict a continuous numeric value.
Predict a discrete label or category.
Output
Continuous (e.g., real numbers).
Categorical (e.g., class labels).
Examples
– Predicting house prices based on features like size and location. – Estimating a person’s weight based on height and age. – Forecasting sales revenue for the next quarter.
– Classifying emails as spam or not spam. – Diagnosing a disease based on patient symptoms. – Identifying whether a customer will buy a product or not.
Typical Algorithms
– Linear Regression – Polynomial Regression – Ridge/Lasso Regression – Support Vector Regression (SVR)
– Logistic Regression – Decision Trees – Random Forests – Support Vector Machines (SVM) – k-Nearest Neighbors (k-NN)
Evaluation Metrics
– Mean Absolute Error (MAE) – Mean Squared Error (MSE) – Root Mean Squared Error (RMSE) – R-squared (R²)
Frequently Asked Questions About Supervised Learning in Machine Learning
What is the difference between supervised and unsupervised learning?
Supervised learning uses labeled data to train models, aiming to predict outcomes or classify data based on known inputs. Unsupervised learning works with unlabeled data, seeking to identify patterns, groupings, or structures without predefined categories.
What are the two 2 types of supervised learning?
The two types of supervised learning are regression, which predicts continuous values, and classification, which predicts discrete categories.
What is an example of supervised machine learning?
An example of supervised machine learning is predicting house prices using a dataset with labeled features (e.g., size, location) and known prices.
What is an example of supervised machine learning classification?
An example of supervised machine learning classification is email spam detection, where the model classifies emails as “spam” or “not spam” based on labeled training data.
Why is supervised learning called so?
Supervised learning is called so because the model is trained on labeled data, with the “supervision” coming from the known input-output pairs that guide the learning process.
What is an example of unsupervised learning?
Real-world applications of unsupervised learning include: – Customer Segmentation: Grouping customers based on purchasing behavior to tailor marketing strategies. – Anomaly Detection: Identifying unusual patterns, such as fraud detection in financial transactions. – Recommendation Systems: Discovering patterns in user preferences to suggest products or content, as seen in streaming services. – Topic Modeling: Extracting topics from large collections of text, like summarizing customer reviews or academic papers.
Is ChatGPT supervised or unsupervised?
ChatGPT is primarily trained using unsupervised learning / self-supervised techniques, where it learns patterns and language structures from large amounts of text data without specific labels or supervision. However, fine-tuning may involve supervised learning, where the model is further trained on a dataset with labeled examples to improve performance on specific tasks or align responses with desired behavior.
Is a decision tree supervised or unsupervised?
A decision tree is a supervised learning algorithm. It is used for both classification and regression tasks, where it learns from labeled data to make predictions or decisions based on input features.
What is another name for supervised learning?
Another name for supervised learning is “labeled learning” or “controlled learning” or “supervised machine learning”.
Is KNN supervised or unsupervised?
K-Nearest Neighbors (KNN) is a supervised learning algorithm. It classifies or predicts the label of a data point based on the labels of its nearest neighbors in the training dataset.
What is the main goal of supervised learning?
The main goal of supervised learning is to train a model to make accurate predictions or classifications based on labeled input-output pairs, using known data to learn patterns that can be applied to new, unseen data.
What is the disadvantage of supervised learning?
A disadvantage of supervised learning is that it requires a large amount of labeled data, which can be time-consuming and expensive to obtain. Additionally, the model’s performance is limited by the quality and representativeness of the training data.
What example uses supervised learning?
Supervised learning is used in a variety of applications, including: Spam Detection: Classifying emails as spam or not spam. Image Classification: Identifying objects or features in images. Medical Diagnosis: Predicting diseases based on patient data. Speech Recognition: Translating spoken language into text. Fraud Detection: Identifying fraudulent transactions in financial systems. Predictive Analytics: Forecasting future trends, such as sales or stock prices.
In the world of product management, the Product Requirements Document (PRD) is the primary tool that outlines the essential features and functionalities of a product. Both business analysts and product managers rely on the PRD to ensure that everyone involved in product development has a clear understanding of what the product should achieve and how it will meet the needs of its users.
A well-crafted PRD serves as a blueprint for the product, guiding the development team through the project lifecycle and ensuring alignment with business goals. This document is crucial for translating the vision of stakeholders into actionable and measurable requirements, making it an indispensable asset in the arsenal of business analysts and product managers.
A Product Requirements Document (PRD) is a crucial artifact in product development that outlines the product vision, features, and functionalities. It serves as a roadmap for the development team to ensure alignment and successful execution. Here’s a step-by-step guide on how to write an effective PRD:
1. Define the Purpose and Scope in the PRD
Purpose: Clearly articulate the objective of the PRD. Explain what the product is intended to achieve and why it is being developed.
Scope: Outline the boundaries of the product. Specify what is included and excluded to prevent scope creep.
2. Describe the Product Overview
Vision: Provide a high-level vision of the product. Describe the overall goals and the problem it aims to solve.
Market and User Needs: Identify the target market and the user personas. Explain the needs and pain points the product addresses. The following are ways to segment and determine audience targets:
Table: Audience Segmentation and Targeting Frameworks
3. List the Features and Functionalities
Feature List: Enumerate the major features and functionalities of the product. Each feature should have a brief description.
User Stories: Write user stories to illustrate how different user personas will interact with the product. Use the format: “As a [user], I want [feature] so that [benefit].” Learn more about user stories here.
Criteria: Specify the acceptance criteria for each feature. This helps the development team understand when a feature is complete and functioning as expected.
5. Detail the Technical Requirements
Architecture: Outline the technical architecture, including platforms, frameworks, and technologies to be used.
Dependencies: List any dependencies on third-party services, APIs, or libraries.
6. Include User Interface (UI) and User Experience (UX) Guidelines
Wireframes and Mockups: Provide wireframes and mockups for key pages and interactions. This helps the development team visualize the end product.
UI/UX Specifications: Detail the design principles, style guides, and user experience considerations.
The PRD plays a pivotal role in the product development process for several reasons:
Clarity and Alignment: The PRD provides a detailed description of the product, ensuring that all stakeholders, including developers, designers, and marketers, have a unified understanding of the project goals and requirements.
Scope Management: By clearly outlining the product features and functionalities, the PRD helps in managing the project scope, preventing scope creep and ensuring that the project stays on track.
Risk Mitigation: A comprehensive PRD identifies potential risks and challenges early in the development process, allowing the team to devise mitigation strategies proactively.
Efficiency and Productivity: With a well-defined PRD, development teams can work more efficiently, focusing their efforts on delivering the specified features within the set timelines.
Quality Assurance: The PRD serves as a reference point for quality assurance teams to verify that the final product meets the outlined specifications and acceptance criteria.
Key Sections of a Product Requirements Document PRD
A thorough PRD typically consists of several key sections, each serving a specific purpose in detailing the product requirements. Here’s a deep dive into the essential components of a PRD:
Executive Summary
Purpose: Provides a high-level overview of the product and its objectives.
Content: Brief description of the product, its target audience, and key goals.
Business Objectives
Purpose: Outlines the strategic goals that the product aims to achieve.
Content: Business goals, market opportunities, and success metrics.
Product Scope
Purpose: Defines the boundaries of the product and what will be included in the initial release.
Content: List of features, functionalities, and any exclusions.
User Personas
Purpose: Describes the target users of the product.
Content: Detailed profiles of typical users, including demographics, behaviors, needs, and pain points.
Functional Requirements
Purpose: Specifies the features and functionalities of the product.
Content: Detailed descriptions of each feature, user stories, and acceptance criteria.
Non-Functional Requirements
Purpose: Defines the performance and usability criteria for the product.
Content: Requirements related to performance, security, scalability, and usability.
User Interface and Experience
Purpose: Describes the design and user interaction aspects of the product.
Content: Wireframes, mockups, and design guidelines.
Technical Specifications
Purpose: Outlines the technical requirements and architecture of the product.
Content: Technology stack, integration points, and technical constraints.
Milestones and Deadlines
Purpose: Defines the timeline for the project.
Content: Key milestones, deadlines, and deliverables.
Resource Requirements
Purpose: Identifies the resources needed for the project.
Content: Team roles, tools, and budget.
Risks and Mitigations
Purpose: Identifies potential risks and their mitigation strategies.
Content: Risk assessment and mitigation plans.
Glossary and References
Purpose: Provides definitions and references for terms and external documents used in the PRD.
Content: Glossary of key terms, links to industry standards, and legal requirements.
Collaboration: Involve all relevant stakeholders, including business analysts, product managers, developers, and designers, in the creation of the PRD to ensure comprehensive coverage and alignment.
Clarity and Precision: Use clear and precise language to avoid ambiguity. Ensure that each requirement is specific, measurable, achievable, relevant, and time-bound (SMART).
User-Centric Approach: Focus on the needs and experiences of the end users. User personas and user stories are crucial in keeping the product aligned with user expectations.
Iterative Refinement: Regularly review and update the PRD as the project progresses. Agile methodologies advocate for iterative refinement to adapt to changing requirements and market conditions.
Validation and Approval: Ensure that the PRD is validated and approved by key stakeholders before development begins. This step is critical for securing buy-in and avoiding future conflicts.
Frequently Asked Questions about the Product Requirements Document PRD
What is a Product Requirements Document (PRD)?
A Product Requirements Document (PRD) is a detailed document that outlines the features, functionalities, and specifications of a product. It serves as a blueprint for the development team and ensures alignment among all stakeholders on what the product should achieve and how it will meet user needs.
Why is a PRD important in product management?
A PRD is crucial because it provides clarity and alignment among team members, manages the project scope, mitigates risks, enhances efficiency and productivity, and serves as a reference for quality assurance. It ensures that the final product meets the specified requirements and business goals.
Who typically creates and uses a PRD?
The PRD is usually created by business analysts and product managers. It is used by the development team, designers, quality assurance testers, marketing teams, and other stakeholders involved in the product development process.
What are the key sections of a PRD?
The main sections of a PRD include: -Executive Summary -Business Objectives -Product Scope -User Personas -Functional Requirements -Non-Functional Requirements -User Interface and Experience -Technical Specifications -Milestones and Deadlines -Resource Requirements -Risks and Mitigations -Glossary and References
How do user personas contribute to a PRD?
User personas provide detailed profiles of typical users, including their demographics, behaviors, needs, and pain points. They help ensure that the product is designed with the end user in mind, aligning features and functionalities with user expectations and requirements.
What is the difference between functional and non-functional requirements?
Functional requirements specify what the product should do, detailing the features and functionalities. Non-functional requirements define the performance, usability, security, and scalability criteria that the product must meet.
How are user stories used in a PRD?
User stories describe the features from the perspective of the end user, detailing what the user wants to achieve and why. They help in creating a user-centric approach and are often accompanied by acceptance criteria to define how the functionality will be verified.
What role does a PRD play in risk management?
A PRD helps identify potential risks early in the development process, allowing the team to devise mitigation strategies. By outlining these risks and their mitigations, the PRD ensures proactive management of potential challenges.
How does a PRD support agile development methodologies?
In agile development, the PRD can be iteratively refined to adapt to changing requirements and market conditions. It provides a flexible and detailed roadmap that can evolve over time, ensuring continuous alignment with business goals and user needs.
What should be included in the glossary and references section of a PRD?
The glossary and references section should include definitions of key terms and acronyms used throughout the PRD, as well as links to relevant external documents, industry standards, and legal requirements (e.g., PCI-DSS, GDPR).
How does a PRD and FRD differ?
The PRD focuses on what the product should do and why, describing the overall vision and features, while the FRD focuses on how the product features will be implemented, detailing specific functionalities and workflows.
How does a PRD differ from a BRD? PRD vs BRD
The PRD provides detailed descriptions of the product’s features and functionalities, guiding the development team, whereas the BRD outlines the business objectives and needs, explaining the business context and strategic goals.
Who primarily uses a PRD?
The PRD is primarily used by the product management team, development team, designers, and quality assurance testers.
Who primarily uses an FRD?
The FRD is primarily used by the development team, engineers, and quality assurance testers to understand and implement the specific functionalities.
Who primarily uses a BRD?
The BRD is primarily used by business stakeholders, including executives, project sponsors, and business analysts, to understand and approve the business objectives.
What content is typically found in a PRD?
A PRD includes feature descriptions, user stories, acceptance criteria, technical specifications, and UI/UX guidelines.
What content is typically found in an FRD?
An FRD includes detailed functional requirements, workflow diagrams, process flows, data models, and API specifications.
What content is typically found in a BRD?
A BRD includes high-level business goals, business processes, KPIs, stakeholder analysis, and business rules.
What is the main focus of a PRD?
The main focus of a PRD is to provide a detailed guide on what the product should achieve and why, aligning the development team on the product’s vision.
What is the main focus of an FRD?
The main focus of an FRD is to provide specific, actionable details on how each feature or functionality will be implemented.
What is the main focus of a BRD?
The main focus of a BRD is to outline the business needs and objectives, explaining why the project is necessary from a business perspective.
In today’s rapidly evolving technological landscape, machine learning has emerged as a transformative force, revolutionizing industries and shaping the way we interact with data. But what exactly is machine learning, and how does it work? In this comprehensive guide, we’ll delve into the world of machine learning, exploring its definition, principles, and practical applications. Whether you’re new to the concept or looking to deepen your understanding, this article will serve as your roadmap to mastering the fundamentals of machine learning.
Understanding Machine Learning
At its core, machine learning is a subset of artificial intelligence (AI) that enables computers to learn from data and improve their performance over time without being explicitly programmed. Unlike traditional computer programming, where rules and instructions are predefined by humans, machine learning algorithms have the ability to analyze large datasets, identify patterns, and make predictions or decisions based on the observed data.
Definition and Evolution
The term “machine learning” was coined in the 1950s by Arthur Samuel, who defined it as the ability of computers to learn from experience without being explicitly programmed. Since then, machine learning has undergone significant advancements, driven by breakthroughs in algorithms, computational power, and the availability of big data. Today, machine learning algorithms power a wide range of applications, from virtual assistants and recommendation systems to autonomous vehicles and healthcare diagnostics.
Types of Machine Learning
Machine learning algorithms can be broadly categorized into three main types: supervised learning, unsupervised learning, and reinforcement learning.
Supervised Learning
Supervised learning involves training a model on labeled data, where the input-output pairs are provided during the training process. The goal is to learn a mapping function that can predict the output for new input data. Common examples of supervised learning algorithms include:
Linear regression
Linear regression is a statistical method used to model the relationship between a dependent variable and one or more independent variables by fitting a straight line to the observed data points.
Logistic regression is a classification algorithm used to predict the probability of a binary outcome based on one or more independent variables by fitting a logistic curve to the observed data points.
Decision trees are a type of supervised learning algorithm used for both classification and regression tasks by splitting the data into smaller subsets based on the most significant features, forming a tree-like structure to make predictions.
Ensemble methods combine multiple machine learning models to improve performance and accuracy by aggregating their predictions, such as bagging, boosting, and stacking. Get started with ensemble techniques here.
Neural networks
Neural networks are a class of machine learning algorithms inspired by the structure and function of the human brain, consisting of interconnected nodes arranged in layers to learn complex patterns and relationships in the data.
Unsupervised Learning
Unsupervised learning, on the other hand, deals with unlabeled data, where the algorithm must discover hidden patterns or structures within the data. Unlike supervised learning, there is no predefined output, and the goal is to uncover insights or group similar data points together. Clustering algorithms like k-means clustering and dimensionality reduction techniques such as principal component analysis (PCA) are examples of unsupervised learning.
Reinforcement Learning
Reinforcement learning is a type of machine learning where an agent learns to interact with an environment by taking actions and receiving feedback or rewards. The agent’s goal is to maximize cumulative rewards over time by learning which actions lead to favorable outcomes. Reinforcement learning has applications in areas like robotics, game playing, and autonomous systems.
The Learning Process
At the heart of machine learning is the learning process, where algorithms iteratively improve their performance by adjusting their parameters or updating their internal representations based on feedback from the data. This process can be summarized in the following steps:
Data Collection: The first step in the learning process is gathering relevant data from various sources, including structured databases, unstructured text, images, and sensor data. High-quality data is essential for training accurate and robust machine learning models.
Data Preprocessing: Once the data is collected, it needs to be cleaned, transformed, and prepared for analysis. This involves tasks like handling missing values, removing outliers, encoding categorical variables, and scaling numerical features. Data preprocessing ensures that the data is in a suitable format for training machine learning models.
Model Selection: Choosing the right machine learning algorithm is crucial for achieving good performance on a given task. The choice of algorithm depends on factors like the nature of the data, the complexity of the problem, and the desired output. It’s important to experiment with different algorithms and evaluate their performance using appropriate metrics.
Model Training: With the algorithm selected, the next step is to train the model on the prepared data. During the training process, the algorithm learns the underlying patterns or relationships in the data by adjusting its parameters iteratively. The goal is to minimize a loss function or objective function that measures the difference between the model’s predictions and the actual values.
Model Evaluation: Once the model is trained, it needs to be evaluated on a separate dataset called the validation set. This allows us to assess how well the model generalizes to new, unseen data and identify any potential issues like overfitting or underfitting. Common evaluation metrics include accuracy, precision, recall, and F1 score, depending on the nature of the problem.
Model Tuning: If the model performance is unsatisfactory, it may be necessary to fine-tune its parameters or adjust the model architecture. This process, known as hyperparameter tuning, involves experimenting with different configurations and selecting the ones that yield the best results on the validation set. Techniques like grid search, random search, and Bayesian optimization can be used for hyperparameter tuning.
Model Deployment: Once the model has been trained and validated, it can be deployed into production environments where it can make predictions or decisions in real-time. Model deployment involves integrating the trained model into existing systems or applications, ensuring scalability, reliability, and performance. It’s important to monitor the model’s performance over time and retrain it periodically to maintain accuracy.
Machine learning has a wide range of applications across various industries and domains, revolutionizing how we work, communicate, and live. Some of the most common applications of machine learning include:
Natural Language Processing (NLP)
NLP is a branch of AI that focuses on the interaction between computers and human language. Machine learning algorithms power NLP applications like sentiment analysis, language translation, chatbots, and text summarization, enabling computers to understand, interpret, and generate human language.
Computer Vision
Computer vision is the field of AI that deals with enabling computers to understand and interpret visual information from the real world. Machine learning techniques like deep learning have led to significant advancements in computer vision tasks such as image classification, object detection, facial recognition, and medical image analysis.
Recommender Systems
Recommender systems are algorithms that analyze user preferences and behavior to provide personalized recommendations for products, services, or content. Machine learning powers recommendation engines used by companies like Amazon, Netflix, and Spotify to suggest products, movies, music, and other items based on user preferences and past interactions.
Predictive Analytics
Predictive analytics involves using historical data to make predictions about future events or outcomes. Machine learning algorithms like regression, time series analysis, and classification are used in predictive analytics applications such as demand forecasting, risk management, fraud detection, and predictive maintenance.
Healthcare
Machine learning has the potential to transform healthcare by enabling early disease detection, personalized treatment plans, and predictive analytics for patient outcomes. AI-powered healthcare applications include medical image analysis, drug discovery, genomics, and remote patient monitoring, leading to more accurate diagnoses and improved patient care.
While machine learning offers immense potential for innovation and advancement, it also presents several challenges and considerations that need to be addressed:
Data Quality: The quality of the training data is crucial for the performance and reliability of machine learning models. Poor-quality data, including missing values, noisy measurements, and biased samples, can lead to inaccurate predictions and unreliable insights. Data cleaning, preprocessing, and validation are essential steps in ensuring data quality.
Model Interpretability: Many machine learning algorithms, especially deep learning models, are often referred to as “black boxes” due to their complex internal structures and lack of interpretability. Understanding how a model arrives at its predictions or decisions is critical for gaining trust and confidence in its outputs, especially in high-stakes domains like healthcare and finance. Researchers and practitioners are actively working on developing techniques for interpreting and explaining machine learning models, such as feature importance analysis, model visualization, and surrogate models.
Ethical and Societal Implications: The widespread adoption of machine learning raises ethical and societal concerns related to privacy, bias, fairness, and accountability. Machine learning algorithms can perpetuate existing biases and discrimination present in the training data, leading to unfair outcomes and social inequalities. It’s essential to develop ethical guidelines, regulations, and frameworks for responsible AI development and deployment, ensuring that machine learning technologies benefit society as a whole.
Scalability and Performance: As machine learning models become increasingly complex and data-intensive, scalability and performance become significant challenges. Training large-scale models on massive datasets requires substantial computational resources, including powerful hardware accelerators like GPUs and TPUs and distributed computing frameworks like Apache Spark and TensorFlow. Optimizing algorithms and architectures for efficiency and scalability is essential for deploying machine learning solutions in real-world applications.
Security and Privacy: Machine learning systems are vulnerable to various security threats and attacks, including data poisoning, model inversion, adversarial examples, and membership inference. Protecting sensitive data and ensuring the confidentiality, integrity, and availability of machine learning models are critical for safeguarding against potential risks and vulnerabilities. Techniques like differential privacy, federated learning, and secure multi-party computation can enhance the security and privacy of machine learning systems.
If you’re interested in learning machine learning, there are several resources and learning paths available to help you get started:
Online Courses and Tutorials: Platforms like Coursera, edX, Udacity, and Khan Academy offer a wide range of online courses and tutorials on machine learning, AI, and data science. These courses cover topics like supervised learning, unsupervised learning, reinforcement learning, deep learning, and natural language processing, catering to learners of all levels, from beginners to advanced practitioners. Or choose our Machine Learning Work Experience Program that offers real work simulated work experiences that hiring managers love!
Books and Publications: There are numerous books and research papers on machine learning theory, algorithms, and applications written by leading experts in the field. Some recommended books include “Pattern Recognition and Machine Learning” by Christopher M. Bishop, “Hands-On Machine Learning with Scikit-Learn, Keras, and TensorFlow” (notebooks) by Aurélien Géron, and “Deep Learning” by Ian Goodfellow, Yoshua Bengio, and Aaron Courville.
Online Communities and Forums: Joining online communities and forums dedicated to machine learning and AI can provide valuable opportunities for learning, networking, and collaboration. Platforms like Reddit, Stack Overflow, GitHub, and Kaggle host active communities where you can ask questions, share insights, and participate in competitions and projects.
Practical Projects and Challenges: Hands-on experience is crucial for mastering machine learning concepts and techniques. Participating in real-world projects, challenges, and competitions on platforms like Kaggle, GitHub, and Google Colab allows you to apply what you’ve learned in a practical setting, gain insights from experienced practitioners, and build a portfolio of projects to showcase your skills to potential employers.
Machine learning is a powerful tool that has the potential to transform industries, drive innovation, and solve complex problems. By understanding the fundamentals of machine learning, exploring its applications, and staying abreast of the latest developments and trends, you can unlock new opportunities for learning, growth, and impact. Whether you’re a student, researcher, developer, or business professional, embracing machine learning opens doors to a world of possibilities and empowers you to shape the future of AI-driven technologies.
Frequently Asked Questions about Beginning with and Learning Machine Learning
What is the roadmap to machine learning?
The roadmap to machine learning typically involves understanding the fundamentals of mathematics, statistics, and programming, followed by learning key machine learning concepts and algorithms. The process of machine learning itself includes steps like data collection, data preprocessing, model selection, training, evaluation, and deployment. Learn more about the process here.
What are the stages of machine learning?
The stages of machine learning include data collection, data preprocessing, feature engineering, model selection, model training, model evaluation, and model deployment.
What are the 5 steps of machine learning CRISP-DM?
The five steps of machine learning are data collection, data preprocessing, model training, model evaluation, and model deployment. Know more about CRISP-DM here.
What is the career path for machine learning?
The career path for machine learning typically involves starting with a strong foundation in mathematics, statistics, and programming, followed by learning machine learning techniques and algorithms. It can lead to roles such as data scientist, machine learning engineer, AI researcher, and data analyst.
What are the 4 basic types of machine learning?
The four basics of machine learning include supervised learning, unsupervised learning, reinforcement learning, and deep learning.
How much Python is required for machine learning?
Python is the most widely used programming language for machine learning due to its simplicity, versatility, and extensive libraries like NumPy, Pandas, Scikit Learn, PyTorch and TensorFlow. A solid understanding of Python basics and intermediate-level proficiency is recommended for machine learning.
Is ML in-demand?
Yes, machine learning is highly in-demand across various industries, including healthcare, finance, e-commerce, and technology. Companies are increasingly leveraging machine learning technologies to gain insights from data, automate processes, and make data-driven decisions.
Is machine learning high paying?
Yes, machine learning professionals are among the highest-paid professionals in the tech industry. Salaries for roles like data scientists, machine learning engineers, and AI researchers are competitive and continue to rise with increasing demand and expertise.
How to start a career in AI ML?
To start a career in AI and machine learning, it’s essential to build a strong foundation in mathematics, statistics, and programming. Take online courses, participate in projects and competitions, build a portfolio, and stay updated with the latest developments and trends in the field. Networking with professionals and joining relevant communities can also help in exploring career opportunities.
In the machine learning lifecycle, data processing plays a critical role at every stage, ultimately leading to the development and deployment of effective models. From data collection and preprocessing to model training, evaluation, and deployment, each step requires careful handling of data to ensure accuracy, reliability, and efficiency. By leveraging various techniques such as cleaning, normalization, feature engineering, and validation, data is refined and transformed to extract meaningful insights and patterns. This structured approach to data processing enables machine learning practitioners to build robust models that can generalize well to unseen data and deliver valuable solutions to real-world problems.
CRoss Industry Standard Process for Data Mining (CRISP-DM)
As the 90’s progressed, the need to standardize the lessons learned into a common methodology became increasingly acute. Two of leading tool providers of the day – SPSS and Teradata – along with three early adopter user corporations, Daimler, NCR, and OHRA convened a Special Interest Group (SIG) in 1996 and over the course of less than a year managed to codify what is still today the CRISP-DM, CRoss Industry Standard Process for Data Mining. CRISP-DM was not actually the first. Nevertheless, within just a year or two many more practitioners were basing their approach on CRISP-DM.
As a methodology, it includes descriptions of the typical phases of a project, the tasks involved with each phase, and an explanation of the relationships between these tasks.
As a process model, CRISP-DM provides an overview of the data mining life cycle.
The life cycle model consists of six phases with arrows indicating the most important and frequent dependencies between phases. The sequence of the phases is not strict. In fact, most projects move back and forth between phases as necessary.
The CRISP-DM model is flexible and can be customized easily. For example, if your organization aims to detect money laundering, it is likely that you will sift through large amounts of data without a specific modeling goal. Instead of modeling, your work will focus on data exploration and visualization to uncover suspicious patterns in financial data. CRISP-DM allows you to create a data mining model that fits your particular needs.
In such a situation, the modeling, evaluation, and deployment phases might be less relevant than the data understanding and preparation phases. However, it is still important to consider some of the questions raised during these later phases for long-term planning and future data mining goals.
CRISP-DM Methodology
The CRISP-DM process or methodology of CRISP-DM is described in these six major steps:
Business Understanding Focuses on understanding the project objectives and requirements from a business perspective. The analyst formulates this knowledge as a data mining problem and develops preliminary plan
Data Understanding Starting with initial data collection, the analyst proceeds with activities to get familiar with the data, identify data quality problems & discover first insights into the data. In this phase, the analyst might also detect interesting subsets to form hypotheses for hidden information
Data Preparation The data preparation phase covers all activities to construct the final dataset from the initial raw data
Modeling The analyst evaluates, selects & applies the appropriate modeling techniques. Since some techniques like neural nets have specific requirements regarding the form of the data. There can be a loop back here to data prep
Evaluation The analyst builds & chooses models that appear to have high quality based on loss functions that were selected. The analyst then tests them to ensure that they can generalize the models against unseen data. Subsequently, the analyst also validates that the models sufficiently cover all key business issues. The end result is the selection of the champion model(s)
Deployment Generally this will mean deploying a code representation of the model into an operating system. This also includes mechanisms to score or categorize new unseen data as it arises. The mechanism should use the new information in the solution of the original business problem. Importantly, the code representation must also include all the data prep steps leading up to modeling. This ensures that the model will treat new raw data in the same manner as during model development
Characteristics of CRISP-DM
CRISP-DM’s longevity in a rapidly changing area stems from a number of characteristics:
It encourages data miners to focus on business goals, so as to ensure that project outputs provide tangible benefits to the organization. Too often, analysts can lose sight of the ultimate business purpose of their analysis – the analysis can become an end in itself rather than a means to an end. The CRISP-DM approach helps ensure that the business goals remain at the centre of the project throughout.
CRISP-DM provides an iterative approach, including frequent opportunities to evaluate the progress of the project against its original objectives. This helps minimize risk of getting to the end of the project and finding that the business objectives have not really been addressed. It also means that the project stakeholders can adapt & change the objectives in the light of new findings.
The CRISP-DM methodology is both technology and problem-neutral. You can use any software you like for your analysis and apply it to any data mining problem you want to. Whatever the nature of your data mining project, CRISP-DM will still provide you with a framework with enough structure to be useful.
Advantages of CRISP-DM
The main advantage of CRISP-DM is in its being a cross-industry standard. It means this methodology can be implemented in any DS project notwithstanding its domain or destination. Below, you will find the list of basic advantages of the CRISP-DM approach for Big Data projects.
Flexibility
No team can avoid pitfalls and mistakes at the beginning of the project. When starting a project, DS teams often suffer from the lack of domain knowledge or ineffective models of data evaluation they have. Thus, a project can become successful only if a team manages to reconfigure its strategy and is able to improve technical processes it applies. Another advantage of CRISP-DM approach is its flexibility. This makes it possible for models and processes to be imperfect at the very beginning. It provides a high level of flexibility that helps improve hypotheses and data analysis methods in a regular manner during further iterations.
Long-term Strategy
CRISP-DM methodology allows to create a long-term strategy based on short iterations at the beginning of project development. During first iterations, a team can create a basic and simple model cycle that can easily be improved in further iterations. This principle allows to ameliorate a preliminarily developed strategy after obtaining additional information and insights.
Functional Templates
The amazing benefit of using a CRISP-DM approach is a possibility to develop functional templates for DS management processes. The best way to take as many benefits as possible from CRISP-DM implementation is to create strict checklists for all phases of the work.
Computer systems now have the ability to automatically learn without being explicitly programmed thanks to machine learning. How does a machine learning system function, though? So, the machine learning life cycle can be used to describe it. Building an effective machine learning project involves a cycle known as the machine learning life cycle. The life cycle’s primary goal is to find a solution for the issue or undertaking.
Knowledge Discovery in Databases – KDD
The term Knowledge Discovery in Databases, or KDD for short, refers to the broad process of finding knowledge in data, and emphasizes the “high-level” application of particular data mining methods. It is of interest to researchers in machine learning, pattern recognition, databases, statistics, artificial intelligence, knowledge acquisition for expert systems, and data visualization.
The unifying goal of the KDD process is to extract knowledge from data in the context of large databases.
It does this by using data mining methods (algorithms) to extract (identify) what is deemed knowledge, according to the specifications of measures and thresholds, using a database along with any required preprocessing, subsampling, and transformations of that database.
An Outline of the Steps of the KDD Process
The overall process of finding and interpreting patterns from data involves the repeated application of the following steps:
Developing an understanding of
the application domain
the relevant prior knowledge
the goals of the end-user
Creating a target data set: selecting a data set, or focusing on a subset of variables, or data samples, on which discovery is to be performed.
Data cleaning and preprocessing.
Removal of noise or outliers.
Collecting necessary information to model or account for noise.
Strategies for handling missing data fields.
Accounting for time sequence information and known changes.
Data reduction and projection.
Finding useful features to represent the data depending on the goal of the task.
Using dimensionality reduction or transformation methods to reduce the effective number of variables under consideration or to find invariant representations for the data.
Choosing the data mining task.
Deciding whether the goal of the KDD process is classification, regression, clustering, etc.
Choosing the data mining algorithm(s).
Selecting method(s) to be used for searching for patterns in the data.
Deciding which models and parameters may be appropriate.
Matching a particular data mining method with the overall criteria of the KDD process.
Data mining.
Searching for patterns of interest in a particular representational form or a set of such representations as classification rules or trees, regression, clustering, and so forth.
Interpreting mined patterns.
Consolidating discovered knowledge.
The terms knowledge discovery and data mining are distinct.
KDD refers to the overall process of discovering useful knowledge from data. It involves the evaluation and possibly interpretation of the patterns to make the decision of what qualifies as knowledge. It also includes the choice of encoding schemes, preprocessing, sampling, and projections of the data prior to the data mining step.
Data mining refers to the application of algorithms for extracting patterns from data without the additional steps of the KDD process.
Model agnostic approach
A model agnostic approach to the machine learning life cycle involves the following major steps, which are given below:
Gathering Data
Data preparation and wrangling
Analyze Data
Train the model
Test the model
Deployment
An enterprise must be able to train, test, and validate machine learning models before deploying them into production in order to produce a successful model.
In order to test, tweak, and optimize models to produce more value, it has become more crucial to cut down on the time required for data preparation. Teams may speed up machine learning and data science initiatives to create an immersive business consumer experience that speeds up and automates the data-to-insight pipeline in order to prepare data for both analytics and machine learning initiatives.
Gathering Data
The first stage of the machine learning life cycle is data gathering. This step’s objective is to locate and collect all data-related issues.
The different data sources must be identified in this step since data can be gathered from a variety of sources, including files, databases, the internet, and mobile devices. It is one of the most crucial phases of the life cycle. The effectiveness of the output will depend on the quantity and caliber of the data gathered. The prediction will be more accurate the more data there is.
This step includes the below tasks:
Identify various data sources
Collect data
Integrate the data obtained from different sources
We obtain a cohesive set of data, also known as a dataset, by carrying out the aforementioned task. It will be used in further steps.
Data Preparation and Wrangling
Data preparation is the process of organizing the data in a way that will be useful for machine learning training.
This stage involves gathering all the data in one place before randomly sorting it.
This step can be further divided into two processes:
Data exploration
To understand the type of data we have to work with, data exploration is performed. We must comprehend the qualities, formats, and properties of the data.A more accurate grasp of the data results in successful results. We discover correlations, broad trends, and outliers in this.
Data pre-processing
Cleaning and transforming unusable raw data into a usable format is known as data pre-processing. It is the process of preparing the data for analysis in the following phase by properly formatting it, choosing the variable to utilize, and cleaning the data. It is among the most crucial steps in the entire procedure. In order to address the quality issues, data cleaning is necessary.
It is not necessary that data we have collected is always of our use as some of the data may not be useful. In real-world applications, collected data may have various issues, including:
Missing Values
Duplicate data
Invalid data
As a result, the data is cleaned using a variety of filtering approaches.
The aforesaid problems must be found and fixed since they have the potential to reduce the quality of the outcome.
Data Analysis
Now the cleaned and prepared data is passed on to the analysis step. This step involves:
Selection of analytical techniques
Building models
Review the result
The goal of this step is to create a machine learning model that will examine the data with a variety of analytical methods and then evaluate the results. In order to develop the model using the prepared data, first determine the problems. Then choose machine learning techniques like classification, regression, cluster analysis, association, etc., and we evaluate the model.
The model must now be trained in order to increase its performance and produce better results when solving problems.
The model is trained using a variety of machine learning algorithms using datasets. A model must be trained in order for it to comprehend the numerous patterns, rules, and features.
A machine learning model is tested once it has been trained on a particular dataset. In this step, the model is given a test dataset to evaluate its accuracy.
Testing the model determines the percentage accuracy of the model as per the requirement of project or problem.
Deployment
Deployment, the final stage of the machine learning life cycle, involves integrating the model into a practical system.
The model gets deployed in the actual system if it is giving an accurate output that meets the requirements quickly enough. However, the project is evaluated to see if it is leveraging the data at hand to improve performance before deployment. The deployment phase is similar to making the final report for a project.
Introduction to Predictive Modeling
Predictive analytics uses methods from data mining, statistics, machine learning, mathematical modeling, and artificial intelligence to make future predictions about unknowable events. It creates forecasts using historical data.
Based on past and present data, predictive modeling is a machine learning technique that forecasts or predicts anticipated future occurrences. Almost anything can be predicted using predictive models, from loan risks and weather forecasts to your next favorite TV show. Predictions frequently address issues like whether a credit card transaction is fraudulent or whether a patient has heart trouble.
To anticipate the future, predictive analytics seeks to identify the contributing elements, collects data, and applies machine learning, data mining, predictive modeling, and other analytical approaches. Insights from the data include patterns and relationships between several aspects that may not have been understood in the past. Finding those hidden ideas is more valuable than one might realize. Predictive analytics are used by businesses to improve their operations and hit their goals. Predictive analytics can make use of both structured and unstructured data insights.
Organizations have chosen to gather enormous volumes of data in recent years, believing that if they gather enough of it, it will eventually result in useful business insights. Even Facebook and Instagram offer analytics to corporate accounts. However, no matter how much data there is, it is useless if it is in its raw form. It becomes increasingly challenging to distinguish important business information from irrelevant data when there is more data to sort through. A data insights strategy is based on the idea that in order to fully utilize data, one must first decide why they are using it and what commercial value they want to derive from it.
Gathering insights from data
Here is how to obtain insights from data and make use of it:
Defining the problem statement/business goal.
Establish the project’s objectives, deliverables, scope of the work, and business goals. Create a questionnaire to collect data depending on the business objective.
Collection of data based on the answers to the questions created based on the problem statement.
Based on the questionnaire, collect answers in the form of datasets.
Integrate the data obtained from various sources.
Data from many sources are prepared for analysis using data mining for predictive analytics. This provides a complete view of the customer interactions.
Data Analysis
Examining, cleansing, transforming, and modeling data with the aim of identifying pertinent information to draw a conclusion is the process of data analysis.
Validate assumptions, hypotheses and test them using statistical models.
Statistical analysis enables validation of the assumptions, hypotheses, and tests them using statistical models.
Model generation
Algorithms are used to construct models that automate the process of combining new and old data. To improve outcomes, multiple models can be mixed.
Deploying the model
By automating the decisions based on the modeling, predictive model deployment offers the option of deploying the analytical results into the everyday decision-making process to provide results, reports, and output.
Poor models and accuracy due to incorrect or inadequate data might result in chaos. To get insights and train the model, a suitable dataset is also absolutely essential. Although predictive analytics has its own difficulties, it can produce priceless commercial results, such as stopping customer churn, optimizing business spending, and satisfying customer demand.
Models and Algorithms
Predictive analytics uses a number of methods from fields like machine learning, data mining, statistics, analysis, and modeling. Machine learning models and deep learning models are two major categories for predictive algorithms. Despite having unique advantages and disadvantages, they all share the ability to be reused and trained using algorithms that follow criteria specific to a given industry. Data gathering, pre-processing, modeling, and deployment are all steps in the iterative process of predictive analytics that results in output.
Once a model is built, we may input new data to generate predictions without having to repeat the training process, but this has the drawback that it requires a huge quantity of data to train. Because predictive analytics relies on machine learning algorithms, it needs accurate data classification in labels to function properly and accurately. The model’s inadequate ability to generalize its conclusions from one scenario to another raises concerns about generalizability. Although there are certain problems with the conclusions from a predictive analytics model’s applicability, these problems can sometimes be resolved using techniques like transfer learning.
Predictive analytics model
CLASSIFICATION MODEL
Of all the models, it is one of the easiest. Based on what it has discovered from the old data, it classifies fresh data. They can be utilized for multiclass classification as well as binary classification by responding to binary questions such as True/False and Yes/No. Some classification techniques include Decision Trees and Support Vector Machines.
Eg. : Loan approval is a classic use case of a classification model. Another example is spam detection messages/emails.
CLUSTERING MODEL
A clustering model clusters data points according to their shared attributes. Despite the fact that there are numerous clustering algorithms, none of them can be deemed the best for all application scenarios. It is an unsupervised learning algorithm, as opposed to supervised classification.
Eg.: Grouping students from a school-based on their location in a city for commute services. Grouping customers based on their item preferences to recommend products related to their interests.
FORECAST MODEL
It deals with metric value prediction, calculating a numerical value for new data based on the lessons from prior data, and is one of the most popular predictive analytics methods. It can be applied wherever numeric data is available.
Eg.: Traffic prediction at a city’s main road during different periods.
OUTLIERS MODEL
It is based, as the name implies, on the dataset’s anomalous data items. A data input error, measurement error, experimental error, data processing mistake, sample error, or natural error can all be considered outliers. Although certain outliers can lead to subpar performance and accuracy, others aid in the discovery of uniqueness or the observation of fresh inferences.
Eg.: Credit/Debit card theft.
TIME SERIES MODEL
It can be used for any sequence of data points with a time period as the input parameter. It uses the past data to develop a numerical metric and predicts the future data using that metric.
Random Forests, Generalized Linear Model, Gradient Boosted Model, K-means clustering, and Prophet are a few popular forecasting algorithms. Combining decision trees, random forests use the “bagging” or “boosting” strategy to try to attain the lowest error possible. A more advanced variation of the general linear model that trains very quickly is the generalized linear model. Any type of exponential distribution type for the response variable can provide a clear insight of how the predictors affect the result.
Predictive Analytics as said already has many applications in different domains. To mention a few,
Healthcare
Collection Analytics
Fraud detection
Risk Management
Direct Marketing
Cross-sell
What is the machine learning lifecycle?
The machine learning lifecycle refers to the series of steps involved in building, training, and deploying machine learning models to solve real-world problems.
What are the steps of machine learning?
The steps of machine learning typically include: – Data collection: Gathering relevant data from various sources. – Data preprocessing: Cleaning, transforming, and preparing the data for analysis. – Model selection: Choosing the appropriate machine learning algorithm for the task. – Model training: Training the selected model on the prepared data. – Model evaluation: Assessing the performance of the trained model using validation data. – Model tuning: Fine-tuning the model parameters to improve performance. – Model deployment: Deploying the trained model for use in real-world applications.
What role does data processing play in the machine learning lifecycle?
Data processing is critical at every stage of the machine learning lifecycle. It involves tasks such as data collection, preprocessing, cleaning, and transformation to ensure that the data is accurate, reliable, and suitable for model training.
What is CRISP-DM, and how does it relate to the machine learning lifecycle?
CRISP-DM (CRoss Industry Standard Process for Data Mining) is a methodology for data mining projects that outlines the typical phases and tasks involved in the data mining process. It provides a structured approach to the machine learning lifecycle, including phases such as business understanding, data preparation, modeling, evaluation, and deployment.
What are the advantages of using the CRISP-DM methodology?
CRISP-DM offers flexibility, allowing teams to adapt their strategies and improve their processes iteratively. It emphasizes the importance of focusing on business goals and provides a technology-neutral framework that can be applied to various data mining projects across different industries.
What are the major steps in the machine learning lifecycle?
The major steps in the machine learning lifecycle include gathering data, data preparation and wrangling, data analysis, model generation, testing the model, and deployment. Each step is essential for building and deploying effective machine learning models.
What is predictive analytics, and how does it relate to machine learning?
Predictive analytics is the process of using data mining, statistical analysis, and machine learning techniques to forecast future outcomes based on historical and present data. It leverages machine learning models to make predictions and identify patterns in data.
What are some common predictive analytics models and algorithms?
Common predictive analytics models include regression models, classification models, clustering models, forecast models, outliers models, and time series models. These models use various algorithms such as decision trees, support vector machines, k-means clustering, and random forests to make predictions and derive insights from data.
What are some applications of predictive analytics in different domains?
Predictive analytics has numerous applications across various domains, including healthcare, finance, marketing, fraud detection, risk management, and customer relationship management. It helps organizations make informed decisions and improve their operational efficiency.
Machine learning (ML) is applied across a wide range of domains and industries. Here are 10 popular domains where machine learning is commonly used:
Healthcare: ML is used for disease diagnosis, drug discovery, patient outcome prediction, and medical image analysis.
Finance: ML is applied in fraud detection, credit scoring, algorithmic trading, and risk assessment.
E-commerce: ML powers recommendation systems, customer segmentation, and demand forecasting.
Natural Language Processing (NLP): ML is used for sentiment analysis, chatbots, language translation, and speech recognition.
Autonomous Vehicles: ML algorithms are essential for self-driving cars, enabling them to perceive and navigate the environment.
Social Media: ML is used for content recommendation, user profiling, and sentiment analysis on platforms like Facebook and Twitter.
Manufacturing: ML optimizes production processes, quality control, and predictive maintenance in manufacturing industries.
Energy: ML is applied in energy consumption forecasting, smart grids, and equipment failure prediction.
Retail: ML enhances inventory management, pricing optimization, and customer experience in retail businesses.
Agriculture: ML is used for crop monitoring, yield prediction, and pest control in precision agriculture.
These are just a few examples, and machine learning has applications in many other domains, including cybersecurity, entertainment, education, and more. The versatility of ML makes it a valuable tool for solving complex problems and making data-driven decisions across various sectors.
Examples and Datasets for Machine Learning projects
Healthcare:
MIMIC-III: A dataset of electronic health records.
Get started easily going from basics to intermediate in data visualization with Python using Matplotlib and Seaborn. This tutorial covers some basic usage patterns and best practices to help you get started with Matplotlib and Seaborn. You will also be introduced to Exploratory Data Analysis (EDA) as a way to use data visualization to better understand your datasets. Understanding these foundational principles will help you create effective and insightful data visualizations that can inform and engage your audience.
import matplotlib as mpl

import matplotlib.pyplot as plt

import numpy as np
A simple example of data visualization with Python
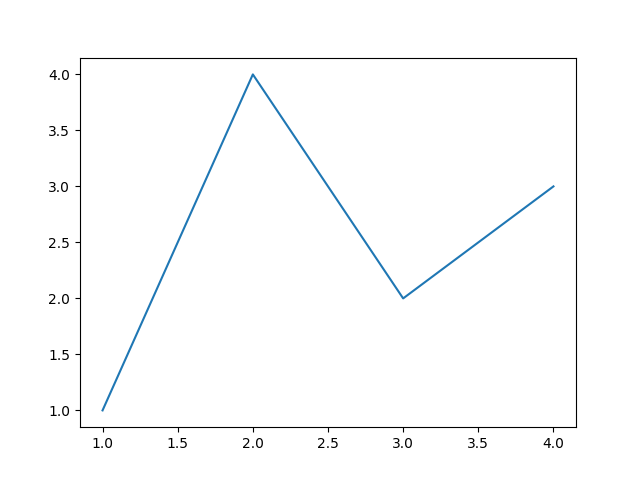
Matplotlib graphs your data on Figures (e.g., windows, Jupyter widgets, etc.), each of which can contain one or more Axes, an area where points can be specified in terms of x-y coordinates (or theta-r in a polar plot, x-y-z in a 3D plot, etc). The simplest way of creating a Figure with an Axes is using pyplot.subplots. We can then use Axes.plot to draw some data on the Axes:
fig, ax = plt.subplots()  # Create a figure containing a single axes.

ax.plot([1, 2, 3, 4], [1, 4, 2, 3]);  # Plot some data on the axes.
Key principles and steps to follow to perform the best data visualization
The foundations of data visualization involve understanding key principles and techniques to effectively communicate data insights. Here are some fundamental concepts:
Know Your Audience: Tailor your visualizations to the knowledge level and interests of your audience.
Choose the Right Chart Type:
Bar Charts: For comparing quantities across categories.
Line Charts: For showing trends over time.
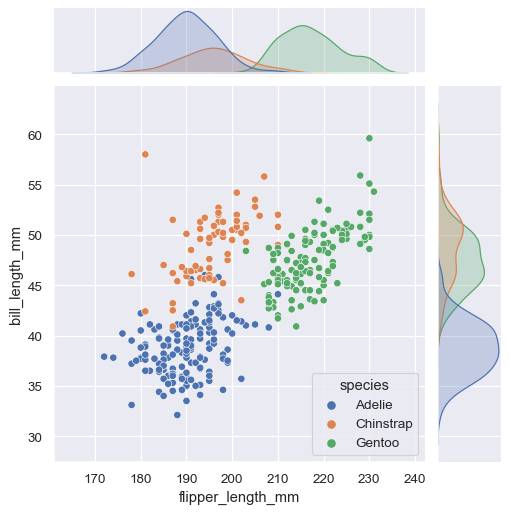
Scatter Plots: For showing relationships between two variables.
Histograms: For showing the distribution of a single variable.
Pie Charts: For showing parts of a whole (though often less effective than bar charts).
Simplify: Keep the visualization as simple as possible to convey the message without unnecessary complexity.
Use Appropriate Scales: Ensure that the scales used (e.g., linear, logarithmic) are appropriate for the data and context.
Label Clearly: Axis labels, titles, and legends should be clear and descriptive to ensure the visualization is understandable.
Use Color Wisely: Colors should enhance comprehension, not distract. Use color to highlight important information or to differentiate between data series.
Highlight Key Points: Emphasize important data points or trends to guide the viewer’s attention.
Maintain Proportions: Avoid distorting data by maintaining proper proportions in the visual representation.
Consider Accessibility: Ensure visualizations are accessible to all users, including those with color vision deficiencies.
Tell a Story: Use the visualization to tell a clear and compelling story about the data.
Parts of a Matplotlib Figure to Visualize Data
Here are the components of a Matplotlib Figure.
Pyplot Figure
The whole figure. The Figure keeps track of all the child Axes, a group of ‘special’ Artists (titles, figure legends, colorbars, etc), and even nested subfigures.
The easiest way to create a new Figure is with pyplot:
fig = plt.figure()  # an empty figure with no Axes

fig, ax = plt.subplots()  # a figure with a single Axes

fig, axs = plt.subplots(2, 2)  # a figure with a 2x2 grid of Axes
It is often convenient to create the Axes together with the Figure, but you can also manually add Axes later on. Note that many Matplotlib backends support zooming and panning on figure windows.
Pyplot Axes
An Axes is an Artist attached to a Figure that contains a region for plotting data, and usually includes two (or three in the case of 3D) Axis objects (be aware of the difference between Axes and Axis) that provide ticks and tick labels to provide scales for the data in the Axes. Each Axes also has a title (set via set_title()), an x-label (set via set_xlabel()), and a y-label set via set_ylabel()).
The Axes class and its member functions are the primary entry point to working with the OOP interface, and have most of the plotting methods defined on them (e.g. ax.plot(), shown above, uses the plot method)
Pyplot Axis
These objects set the scale and limits and generate ticks (the marks on the Axis) and ticklabels (strings labeling the ticks). The location of the ticks is determined by a Locator object and the ticklabel strings are formatted by a Formatter. The combination of the correct Locator and Formatter gives very fine control over the tick locations and labels.
Pyplot Artist
Basically, everything visible on the Figure is an Artist (even Figure, Axes, and Axis objects). This includes Text objects, Line2D objects, collections objects, Patch objects, etc. When the Figure is rendered, all of the Artists are drawn to the canvas. Most Artists are tied to an Axes; such an Artist cannot be shared by multiple Axes, or moved from one to another.
Types of inputs to Matplotlib plotting functions
Plotting functions expect numpy.array or numpy.ma.masked_array as input, or objects that can be passed to numpy.asarray. Classes that are similar to arrays (‘array-like’) such as pandas data objects and numpy.matrix may not work as intended. Common convention is to convert these to numpy.array objects prior to plotting. For example, to convert a numpy.matrix
b = np.matrix([[1, 2], [3, 4]])

b_asarray = np.asarray(b)
Most methods will also parse an addressable object like a dict, a numpy.recarray, or a pandas.DataFrame. Matplotlib allows you provide the data keyword argument and generate plots passing the strings corresponding to the x and y variables.
ax.plot(x, x, label='linear') # Plot some data on the axes.
ax.plot(x, x**2, label='quadratic') # Plot more data on the axes...
ax.plot(x, x**3, label='cubic') # ... and some more.
ax.set_xlabel('x label') # Add an x-label to the axes.
ax.set_ylabel('y label') # Add a y-label to the axes.
ax.set_title("Simple Plot") # Add a title to the axes.
ax.legend(); # Add a legend.
Pyplot Interface
x = np.linspace(0, 2, 100)  # Sample data.

plt.figure(figsize=(5, 2.7), layout='constrained')

plt.plot(x, x, label='linear')  # Plot some data on the (implicit) axes.

plt.plot(x, x**2, label='quadratic')  # etc.

plt.plot(x, x**3, label='cubic')

plt.xlabel('x label')

plt.ylabel('y label')

plt.title("Simple Plot")

plt.legend()
Matplotlib’s documentation and examples use both the OO and the pyplot styles. In general, we suggest using the OO style, particularly for complicated plots, and functions and scripts that are intended to be reused as part of a larger project. However, the pyplot style can be very convenient for quick interactive work.
Helper functions in Matplotlib
If you need to make the same plots over and over again with different data sets, or want to easily wrap Matplotlib methods, use the recommended signature function below.
def my_plotter(ax, data1, data2, param_dict):
""" A helper function to make a graph. """
out = ax.plot(data1, data2, **param_dict)
return out
data1, data2, data3, data4 = np.random.randn(4, 100) # make 4 random data sets
# use the helper function twice to populate two subplots:
my_plotter(ax1, data1, data2, {'marker': 'x'})
my_plotter(ax2, data3, data4, {'marker': 'o'});
Styling Artists
Most plotting methods have styling options for the Artists, accessible either when a plotting method is called, or from a “setter” on the Artist. In the plot below we manually set the color, linewidth, and linestyle of the Artists created by plot, and we set the linestyle of the second line after the fact with set_linestyle.
Matplotlib has a very flexible array of colors that are accepted for most Artists; see the colors tutorial for a list of specifications. Some Artists will take multiple colors. i.e. for a scatter plot, the edge of the markers can be different colors from the interior:
Line widths are typically in typographic points (1 pt = 1/72 inch) and available for Artists that have stroked lines. Similarly, stroked lines can have a linestyle. See the linestyles example.
Marker size depends on the method being used. plot specifies markersize in points, and is generally the “diameter” or width of the marker. scatter specifies markersize as approximately proportional to the visual area of the marker. There is an array of markerstyles available as string codes (see markers), or users can define their own MarkerStyle (see Marker reference):
set_xlabel, set_ylabel, and set_title are used to add text in the indicated locations (see Text in Matplotlib Plots for more discussion). Text can also be directly added to plots using text:
mu, sigma = 115, 15

x = mu + sigma * np.random.randn(10000)

fig, ax = plt.subplots(figsize=(5, 2.7), layout='constrained')

# the histogram of the data

n, bins, patches = ax.hist(x, 50, density=1, facecolor='C0', alpha=0.75)

ax.set_xlabel('Length [cm]')

ax.set_ylabel('Probability')

ax.set_title('Aardvark lengths\n (not really)')

ax.text(75, .025, r'$\mu=115,\ \sigma=15$')

ax.axis([55, 175, 0, 0.03])

ax.grid(True)
All of the text functions return a matplotlib.text.Text instance. Just as with lines above, you can customize the properties by passing keyword arguments into the text functions:
t = ax.set_xlabel('my data', fontsize=14, color='red')
Using mathematical expressions in text
Matplotlib accepts TeX equation expressions in any text expression. For example to write the expression
σi=15
in the title, you can write a TeX expression surrounded by dollar signs:
ax.set_title(r'$\sigma_i=15$')
where the r preceding the title string signifies that the string is a raw string and not to treat backslashes as python escapes. Matplotlib has a built-in TeX expression parser and layout engine, and ships its own math fonts – for details see Writing mathematical expressions. You can also use LaTeX directly to format your text and incorporate the output directly into your display figures or saved postscript.
Annotating your Matplotlib charts
We can also annotate points on a plot, often by connecting an arrow pointing to xy, to a piece of text at xy text:
Legends in Matplotlib are quite flexible in layout, placement, and what Artists they can represent.
X Axis and Y Axis scales and ticks
Each Axes has two (or three) Axis objects representing the x- and y-axis. These control the scale of the Axis, the tick locators and the tick formatters. Additional Axes can be attached to display further Axis objects.
Scales
In addition to the linear scale, Matplotlib supplies non-linear scales, such as a log-scale. Since log-scales are used so much there are also direct methods like loglog, semilogx, and semilogy. There are a number of scales (see Scales for other examples). Here we set the scale manually:
fig, axs = plt.subplots(1, 2, figsize=(5, 2.7), layout='constrained')

xdata = np.arange(len(data1))  # make an ordinal for this

data = 10**data1

axs[0].plot(xdata, data)

axs[1].set_yscale('log')

axs[1].plot(xdata, data)
The scale sets the mapping from data values to spacing along the Axis. This happens in both directions, and gets combined into a transform, which is the way that Matplotlib maps from data coordinates to Axes, Figure, or screen coordinates.
Tick locators and formatters
Each Axis has a tick locator and formatter that choose where along the Axis objects to put tick marks. A simple interface to this is set_xticks:
fig, axs = plt.subplots(2, 1, layout='constrained')

axs[0].plot(xdata, data1)

axs[0].set_title('Automatic ticks')

axs[1].plot(xdata, data1)

axs[1].set_xticks(np.arange(0, 100, 30), ['zero', '30', 'sixty', '90'])

axs[1].set_yticks([-1.5, 0, 1.5])  # note that we don't need to specify labels

axs[1].set_title('Manual ticks')
Different scales can have different locators and formatters; for instance the log-scale above uses LogLocator and LogFormatter.
Plotting dates and strings in your data visualization with Python
Matplotlib can handle plotting arrays of dates and arrays of strings, as well as floating point numbers. These get special locators and formatters as appropriate. For dates:
One caveat about categorical plotting is that some methods of parsing text files return a list of strings, even if the strings all represent numbers or dates. If you pass 1000 strings, Matplotlib will think you meant 1000 categories and will add 1000 ticks to your plot!
Additional Axis objects
Plotting data of different magnitude in one chart may require an additional y-axis. Such an Axis can be created by using twinx to add a new Axes with an invisible x-axis and a y-axis positioned at the right (analogously for twiny). See Plots with different scales for another example.
Similarly, you can add a secondary_xaxis or secondary_yaxis having a different scale than the main Axis to represent the data in different scales or units. See Secondary Axis for further examples.
pc = axs[0, 0].pcolormesh(X, Y, Z, vmin=-1, vmax=1, cmap='RdBu_r')
fig.colorbar(pc, ax=axs[0, 0])
axs[0, 0].set_title('pcolormesh()')
co = axs[0, 1].contourf(X, Y, Z, levels=np.linspace(-1.25, 1.25, 11))
fig.colorbar(co, ax=axs[0, 1])
axs[0, 1].set_title('contourf()')
pc = axs[1, 0].imshow(Z**2 * 100, cmap='plasma', norm=mpl.colors.LogNorm(vmin=0.01, vmax=100))
fig.colorbar(pc, ax=axs[1, 0], extend='both')
axs[1, 0].set_title('imshow() with LogNorm()')
pc = axs[1, 1].scatter(data1, data2, c=data3, cmap='RdBu_r')
fig.colorbar(pc, ax=axs[1, 1], extend='both')
axs[1, 1].set_title('scatter()')
Combine multiple visualizations – Working with multiple Figures and Axes
You can open multiple Figures with multiple calls to fig = plt.figure() or fig2, ax = plt.subplots(). By keeping the object references you can add Artists to either Figure.
Multiple Axes can be added a number of ways, but the most basic is plt.subplots() as used above. One can achieve more complex layouts, with Axes objects spanning columns or rows, using subplot_mosaic.
Learn to work with Seaborn Python code – Basic Usage
Most of your interactions with seaborn will happen through a set of plotting functions. Later chapters in the tutorial will explore the specific features offered by each function. This chapter will introduce, at a high-level, the different kinds of functions that you will encounter.
The Seaborn package can be imported as follows:
import seaborn as sns
Seaborn’s similar functions for similar tasks
The seaborn namespace is flat; all of the functionality is accessible at the top level. But the code itself is hierarchically structured, with modules of functions that achieve similar visualization goals through different means. Most of the docs are structured around these modules: you’ll encounter names like “relational”, “distributional”, and “categorical”.
Histogram in Seaborn
For example, the distributions module defines functions that specialize in representing the distribution of datapoints. This includes familiar methods like the histogram:
Functions within a module share a lot of underlying code and offer similar features that may not be present in other components of the library (such as multiple=”stack” in the examples above). They are designed to facilitate switching between different visual representations as you explore a dataset, because different representations often have complementary strengths and weaknesses.
Figure-level vs. axes-level functions in Seaborn
In addition to the different modules, there is a cross-cutting classification of seaborn functions as “axes-level” or “figure-level”. The examples above are axes-level functions. They plot data onto a single matplotlib.pyplot.Axes object, which is the return value of the function.
In contrast, figure-level functions interface with matplotlib through a seaborn object, usually a FacetGrid, that manages the figure. Each module has a single figure-level function, which offers a unitary interface to its various axes-level functions. The organization looks a bit like this:
Displot in Seaborn
For example, displot() is the figure-level function for the distributions module. Its default behavior is to draw a histogram, using the same code as histplot() behind the scenes:
You’ll notice that the figure-level plots look mostly like their axes-level counterparts, but there are a few differences. Notably, the legend is placed ouside the plot. They also have a slightly different shape (more on that shortly).
The most useful feature offered by the figure-level functions is that they can easily create figures with multiple subplots. For example, instead of stacking the three distributions for each species of penguins in the same axes, we can “facet” them by plotting each distribution across the columns of the figure:
The figure-level functions wrap their axes-level counterparts and pass the kind-specific keyword arguments (such as the bin size for a histogram) down to the underlying function. That means they are no less flexible, but there is a downside: the kind-specific parameters don’t appear in the function signature or docstrings. Some of their features might be less discoverable, and you may need to look at two different pages of the documentation before understanding how to achieve a specific goal.
Axes-level functions make self-contained plots in Seaborn
The axes-level functions are written to act like drop-in replacements for matplotlib functions. While they add axis labels and legends automatically, they don’t modify anything beyond the axes that they are drawn into. That means they can be composed into arbitrarily-complex matplotlib figures with predictable results.
The axes-level functions call matplotlib.pyplot.gca() internally, which hooks into the matplotlib state-machine interface so that they draw their plots on the “currently-active” axes. But they additionally accept an ax= argument, which integrates with the object-oriented interface and lets you specify exactly where each plot should go:
Figure-level functions own their figure in Seaborn
In contrast, figure-level functions cannot (easily) be composed with other plots. By design, they “own” their own figure, including its initialization, so there’s no notion of using a figure-level function to draw a plot onto an existing axes. This constraint allows the figure-level functions to implement features such as putting the legend outside of the plot.
Nevertheless, it is possible to go beyond what the figure-level functions offer by accessing the matplotlib axes on the object that they return and adding other elements to the plot that way:
tips = sns.load_dataset("tips")
g = sns.relplot(data=tips, x="total_bill", y="tip")
You should also attempt creating the linear regression model to determine its coefficients and intercept. Learn about linear regression here.
Example:
# Create a linear regression model
reg = LinearRegression()

# Fit the model to the data
reg.fit(X_train, y_train)

# Print the intercept and coefficients
print(reg.intercept_)
print(reg.coef_)
Customizing plots from a figure-level function in Seaborn
The figure-level functions return a FacetGrid instance, which has a few methods for customizing attributes of the plot in a way that is “smart” about the subplot organization. For example, you can change the labels on the external axes using a single line of code:
g = sns.relplot(data=penguins, x="flipper_length_mm", y="bill_length_mm", col="sex")
While convenient, this does add a bit of extra complexity, as you need to remember that this method is not part of the matplotlib API and exists only when using a figure-level function.
Specifying figure sizes in Seaborn
To increase or decrease the size of a matplotlib plot, you set the width and height of the entire figure, either in the global rcParams, while setting up the plot (e.g. with the figsize parameter of matplotlib.pyplot.subplots()), or by calling a method on the figure object (e.g. matplotlib.Figure.set_size_inches()). When using an axes-level function in seaborn, the same rules apply: the size of the plot is determined by the size of the figure it is part of and the axes layout in that figure.
When using a figure-level function, there are several key differences. First, the functions themselves have parameters to control the figure size (although these are actually parameters of the underlying FacetGrid that manages the figure). Second, these parameters, height and aspect, parameterize the size slightly differently than the width, height parameterization in matplotlib (using the seaborn parameters, width = height * apsect). Most importantly, the parameters correspond to the size of each subplot, rather than the size of the overall figure.
To illustrate the difference between these approaches, here is the default output of matplotlib.pyplot.subplots() with one subplot:
f, ax = plt.subplots()
A figure with multiple columns will have the same overall size, but the axes will be squeezed horizontally to fit in the space:
f, ax = plt.subplots(1, 2, sharey=True)
Facetgrid in Seaborn
In contrast, a plot created by a figure-level function will be square. To demonstrate that, let’s set up an empty plot by using FacetGrid directly. This happens behind the scenes in functions like relplot(), displot(), or catplot():
g = sns.FacetGrid(penguins)
When additional columns are added, the figure itself will become wider, so that its subplots have the same size and shape:
g = sns.FacetGrid(penguins, col="sex")
And you can adjust the size and shape of each subplot without accounting for the total number of rows and columns in the figure:
g = sns.FacetGrid(penguins, col="sex", height=3.5, aspect=.75)
The upshot is that you can assign faceting variables without stopping to think about how you’ll need to adjust the total figure size. A downside is that, when you do want to change the figure size, you’ll need to remember that things work a bit differently than they do in matplotlib.
Relative merits of figure-level functions in Seaborn
Here is a summary of the pros and cons that we have discussed above:
Advantages
Drawbacks
Easy faceting by data variables
Many parameters not in function signature
Legend outside of plot by default
Cannot be part of a larger matplotlib figure
Easy figure-level customization
Different API from matplotlib
On balance, the figure-level functions add some additional complexity that can make things more confusing for beginners, but their distinct features give them additional power. The tutorial documentation mostly uses the figure-level functions, because they produce slightly cleaner plots, and we generally recommend their use for most applications. The one situation where they are not a good choice is when you need to make a complex, standalone figure that composes multiple different plot kinds. At this point, it’s recommended to set up the figure using matplotlib directly and to fill in the individual components using axes-level functions.
Combining multiple views on the data -Sample exploratory data analysis
Two important plotting functions in seaborn don’t fit cleanly into the classification scheme discussed above. These functions, jointplot() and pairplot(), employ multiple kinds of plots from different modules to represent multiple aspects of a dataset in a single figure. Both plots are figure-level functions and create figures with multiple subplots by default. But they use different objects to manage the figure: JointGrid and PairGrid, respectively.
Jointplot
jointplot() plots the relationship or joint distribution of two variables while adding marginal axes that show the univariate distribution of each one separately:
pairplot() is similar — it combines joint and marginal views — but rather than focusing on a single relationship, it visualizes every pairwise combination of variables simultaneously:
sns.pairplot(data=penguins, hue="species")
Behind the scenes, these functions are using axes-level functions that you have already met (scatterplot() and kdeplot()), and they also have a kind parameter that lets you quickly swap in a different representation:
Data visualization generally enhances understanding, promotes collaboration, and facilitates informed decision-making, thus making it a valuable tool for data analysis and communication. Review the following advantages of data visualization:
Improved Understanding: Visual representations of data make complex information easier to comprehend and interpret.
Insight Discovery: Visualizations can reveal patterns, trends, and relationships that may not be apparent in raw data, leading to new insights and discoveries.
Effective Communication: Visualizations facilitate clear and concise communication of data insights to stakeholders, helping to convey messages more effectively than raw data or text alone.
Decision Making: Visualizations enable informed decision-making by providing stakeholders with actionable insights and evidence-based recommendations.
Increased Engagement: Engaging and visually appealing graphics capture attention and encourage interaction with the data, fostering greater engagement and understanding.
Efficient Analysis: Visualizations streamline the data analysis process by allowing users to quickly identify relevant information and focus on key areas of interest.
Collaboration: Visualizations promote collaboration among team members by providing a common understanding of the data and facilitating discussions and brainstorming sessions.
Reference and further reading for data visualization with Python, Matplotlib and Seaborn
Frequently Asked Questions about data visualization with Python, Matplotlib and Seaborn
What is data visualization in Python?
Data visualization in Python refers to the process of creating graphical representations of data using Python plotting libraries. It helps in understanding data patterns, trends, and relationships by displaying data in forms such as plots, charts, and graphs. Popular libraries for data visualization in Python include Matplotlib, Seaborn, Plotly, and Bokeh. These tools offer a range of customization options to create informative and visually appealing visualizations.
Is Python good for data Visualization?
Yes, Python is excellent for data visualization. With libraries like Matplotlib, Seaborn, Plotly, and Bokeh, Python provides powerful tools for creating a wide range of visualizations. These libraries offer flexibility, interactivity, and a variety of plotting options, making Python a popular choice for data visualization tasks. Additionally, Python’s simplicity and ease of use make it accessible to beginners while also providing advanced features for more experienced users.
What are the basic principles of data visualization?
The basics key principles of data visualization involve tailoring visualizations to the audience, choosing appropriate chart types (e.g., bar, line, scatter, histograms, pie), simplifying visuals, using appropriate scales and clear labeling, using color effectively, highlighting key points, maintaining proportions, considering accessibility, and telling a compelling story with the data. These principles help create effective and engaging visualizations that communicate data insights effectively.
What are the advantages of data visualization?
Data visualization offers several advantages such as enhanced comprehension of complex information, discovery of patterns and trends in data, clear communication of insights to stakeholders, support for informed decision-making, increased engagement through visually appealing graphics, streamlined data analysis process, and promotion of collaboration among team members.
What is meant by exploratory data analysis (EDA)?
Exploratory Data Analysis (EDA) refers to the process of analyzing datasets to summarize their main characteristics, often using visual methods. It involves: – Understanding Data Structure: Identifying data types, dimensions, and structures. – Detecting Outliers and Anomalies: Finding unusual data points. – Identifying Patterns and Relationships: Using visualizations to uncover trends and correlations. – Summarizing Data: Computing summary statistics like mean, median, and standard deviation. – Checking Assumptions: Verifying assumptions for statistical models.
What is EDA used for?
Exploratory Data Analysis (EDA) is used for: – Understanding Data: Getting an initial sense of the data’s structure, quality, and key characteristics. – Detecting Anomalies: Identifying outliers, missing values, and errors. – Finding Patterns and Relationships: Discovering trends, correlations, and potential causal relationships. – Guiding Further Analysis: Informing the selection of appropriate statistical models and analysis techniques. – Generating Hypotheses: Formulating questions and hypotheses for deeper investigation.
What are the steps of EDA (exploratory data analysis)?
The steps of Exploratory Data Analysis (EDA) typically include: – Data Collection: Gathering the relevant data from various sources. – Data Cleaning: Handling missing values, correcting errors, and dealing with outliers. – Data Profiling: Summarizing the main characteristics of the data using descriptive statistics. – Data Visualization: Creating plots and charts to visualize the data distributions, trends, and relationships. – Feature Engineering: Creating new features or transforming existing ones to improve analysis. – Hypothesis Testing: Conducting preliminary statistical tests to identify significant patterns or relationships. – Insights and Reporting: Documenting findings and insights for further analysis or decision-making.
What is Matplotlib?
Matplotlib is a Python library used for creating static, animated, and interactive visualizations in Python.
How do you create a simple plot using Matplotlib?
You can create a simple plot using Matplotlib by calling the plot function and passing the data to be plotted.
What are the components of a Matplotlib Figure?
The components of a Matplotlib Figure include the Figure itself, Axes, Axis, and Artists.
How do you create a Figure with multiple Axes?
You can create a Figure with multiple Axes using plt.subplots() and specifying the desired number of rows and columns.
What is the difference between the object-oriented (OO) style and the pyplot style in Matplotlib?
In the object-oriented (OO) style, you explicitly create Figures and Axes objects and call methods on them, while in the pyplot style, you rely on pyplot to manage Figures and Axes automatically.
What are some advantages of using the object-oriented style in Matplotlib?
The object-oriented style offers more control and flexibility, making it suitable for complex plots and reusable code.
What types of inputs do Matplotlib plotting functions expect?
Matplotlib plotting functions expect numpy arrays or objects that can be converted to arrays using numpy.asarray.
What is Seaborn in data visualization?
Seaborn is a Python visualization library based on Matplotlib that provides a high-level interface for drawing attractive and informative statistical graphics.
How do you import Seaborn?
Seaborn can be imported using the statement import seaborn as sns.
What is the purpose of pairplot in Seaborn?
The purpose of pairplot in Seaborn is to visualize pairwise relationships between variables in a dataset, displaying scatterplots for continuous variables and histograms for the marginal distributions.
How do you customize the appearance of plots created with Seaborn?
You can customize the appearance of plots created with Seaborn using various parameters and attributes provided by the plotting functions, such as hue, size, and style.
What is the advantage of using figure-level functions in Seaborn?
Figure-level functions in Seaborn offer easy faceting by data variables and provide a unified interface for customizing plots across multiple subplots.
What are the advantages of seaborn?
High-Level Interface: Seaborn offers a high-level interface for creating complex statistical visualizations with minimal code, making it easier to generate sophisticated plots compared to Matplotlib. Attractive Defaults: Seaborn comes with attractive default styles and color palettes, allowing users to create visually appealing plots without manual customization. Statistical Visualization: Seaborn is specifically designed for statistical data visualization, providing specialized functions for exploring relationships between variables, visualizing distributions, and identifying patterns in data. Integration with Pandas: Seaborn seamlessly integrates with pandas data structures, enabling users to directly visualize datasets loaded into pandas DataFrames without preprocessing. Faceting and Grids: Seaborn offers convenient functions for creating grid-based plots and faceted visualizations, allowing users to explore multiple aspects of their data simultaneously.
How do you specify figure sizes in Seaborn?
Figure sizes in Seaborn can be specified using parameters like height and aspect in figure-level functions, which control the size and shape of each subplot.
Can you combine multiple views of data in a single figure using Seaborn?
Yes, you can combine multiple views of data in a single figure using Seaborn’s jointplot and pairplot functions, which display joint distributions and marginal distributions simultaneously.
What is the difference between Matplotlib and Seaborn?
Matplotlib is a foundational Python library used for creating a wide range of static, animated, and interactive visualizations. It offers extensive control over plot elements and is highly customizable. However, it can be verbose and requires more code to achieve aesthetically pleasing plots. Seaborn, on the other hand, is built on top of Matplotlib and provides a high-level interface for drawing attractive and informative statistical graphics with less code. Seaborn is specifically designed for statistical visualization and comes with built-in themes and color palettes, making it easier to produce visually appealing and informative plots. It also integrates well with pandas data structures, simplifying the process of working with datasets.
User Acceptance Testing (UAT) stands as a pivotal phase in the realm of software development, ensuring that software solutions align perfectly with user needs and expectations. As organizations strive for seamless and reliable software, UAT emerges as an indispensable process that bridges the gap between development and user satisfaction. In this article, we delve into the significance of User Acceptance Testing, exploring its definition, role in software development, and a glimpse into the content that follows.
Definition of User Acceptance Testing (UAT)
User Acceptance Testing, commonly referred to as UAT, is the final testing phase before software is released to its intended users. It involves evaluating the software’s functionality and performance to ensure that it meets predefined acceptance criteria. UAT is primarily executed by end-users, validating whether the software fulfills their requirements and expectations. This testing phase extends beyond technical validation, focusing on the software’s user-friendliness, usability, and alignment with real-world scenarios.
Importance of UAT in Software Development
UAT holds immense importance in the software development lifecycle for several reasons. It serves as the ultimate litmus test, determining if the software is ready for its intended users. While previous testing phases uncover technical glitches, UAT ensures that the software makes sense from an end-user perspective. It safeguards against releasing software that might be functionally accurate but lacks practical usability. UAT serves as a direct feedback loop from users to developers, highlighting any deviations from the intended user experience.
Brief overview of the article content
In this article, we embark on a journey to explore the facets of User Acceptance Testing. We delve into a comprehensive guide on the UAT process, providing insights into each step from planning to execution. Discover how meticulous planning and thorough execution of UAT scenarios contribute to the overall software quality.
Unveil the numerous benefits UAT brings to the table – from ensuring software meets user requirements to enhancing user satisfaction and minimizing post-release surprises. Understand the key considerations that lead to effective UAT implementation, from defining clear acceptance criteria to addressing potential security concerns.
Explore real-world challenges that UAT endeavors to overcome, and the strategies employed to conquer them. Additionally, learn about the automation tools that amplify UAT efficiency and delve into a compelling UAT success story that underscores the impact of a meticulous testing approach.
As we journey through the various dimensions of User Acceptance Testing, one thing becomes clear: UAT is not just a phase; it’s a commitment to delivering software that aligns with user needs, enriching both the software experience and user satisfaction.
Business Analysts (BA) are expected to perform UAT testing. Become a great BA with the Business Analyst Work Experience Program
User Acceptance Testing (UAT) stands as the ultimate checkpoint in software development, where the rubber meets the road for end-user satisfaction. This comprehensive guide sheds light on the intricate process of UAT, unveiling its stages and essential steps that pave the way for flawless software delivery.
Explanation of the UAT process stages
The UAT process comprises distinct stages that collectively contribute to delivering software excellence.
User acceptance testing (UAT) process
Steps involved in planning UAT
User acceptance testing begins with understanding the software’s objectives and scope, followed by devising test cases that mirror real-world user scenarios. Subsequently, executing these scenarios illuminates potential discrepancies between user expectations and the software’s performance. Capturing and addressing defects that emerge during testing lead us to the final stages: reviewing and approving UAT results.
Planning UAT: Laying the Foundation
Effective UAT begins with meticulous planning. It involves collaborating with stakeholders to define clear acceptance criteria that the software must meet. This phase also necessitates identifying and involving the right participants – the end-users whose feedback will determine the software’s readiness. The planning stage sets the tone for a structured UAT execution, ensuring every critical aspect is addressed.
Executing UAT Scenarios and Test Cases
With the groundwork laid, the execution phase commences. End-users embark on a journey to simulate real-life scenarios, testing the software’s functionalities in various contexts. This stage is marked by the deliberate exploration of the software, evaluating its performance, ease of use, and alignment with user expectations. Each scenario and test case scrutinizes different aspects of the software, contributing to a holistic understanding of its capabilities.
Capturing and Reporting UAT Defects
UAT thrives on transparency, and defects are part of that reality. As end-users traverse the software landscape, any deviations from the expected user experience are noted and documented. This phase isn’t about blame but improvement. It’s an opportunity to refine the software based on real user interactions, fostering a user-centric approach to development.
Review and Approval of UAT Results
The journey concludes with a meticulous review of UAT results. Stakeholders and end-users collaboratively assess the software’s performance against acceptance criteria. The insights garnered during testing guide the decision-making process. Upon approval, the software is deemed ready for release, backed by the confidence that it meets user needs and expectations.
In the intricate realm of software development, one pivotal phase emerges as the lighthouse of assurance – User Acceptance Testing (UAT). This process not only bridges the gap between developer intentions and user expectations but also showers a multitude of benefits that elevate the entire software experience.
Ensuring software meets user requirements
The heart of UAT beats to the rhythm of user needs. It serves as the ultimate validation that software aligns with the intricate requirements of its intended users. As end-users meticulously navigate through the software, their interactions unveil the extent to which the software caters to their needs and aspirations. This process instills a profound sense of alignment, where every code and feature resonates with the essence of user expectations.
Minimizing post-release issues and user dissatisfaction
Imagine a scenario where a software release triggers an array of user grievances. User Acceptance Testing is the sentinel against such possibilities. By simulating real-world scenarios, UAT uncovers issues that might have remained dormant in the developmental shadows. By addressing these concerns pre-release, it becomes a guardian against the ripple effect of post-release dissatisfaction.
Increasing confidence in the software’s reliability
Software users seek reliability, an unwavering trust that the solution will deliver as promised. UAT emerges as a catalyst in cultivating this trust. As end-users meticulously validate the software’s functionalities, their experiences shape a robust belief in the software’s reliability. This phase doesn’t merely test; it builds an unshakable bridge of faith between the software and its users.
Enhancing user experience and satisfaction
User experience reigns supreme, and UAT serves as its advocate. Every test, scenario, and interaction contributes to refining the user journey. Flaws are ironed out, processes streamlined, and user-friendliness optimized. As end-users traverse the software landscape seamlessly, they’re greeted with an experience that mirrors their desires and aspirations. This harmonious user experience becomes the cornerstone of ultimate satisfaction.
Key Considerations for Effective UAT
Imagine a world where software meets not only functional standards but user aspirations. This world is within reach through User Acceptance Testing (UAT), a crucial phase that transforms software dreams into user realities. To harness the power of UAT, several key considerations come into play, ensuring the perfect blend of user satisfaction and software excellence.
Defining clear acceptance criteria for UAT
UAT doesn’t thrive in ambiguity; it flourishes with clarity. Defining crystal-clear acceptance criteria is akin to setting the compass for a successful UAT journey. These criteria outline the boundaries of excellence that the software must meet. With these boundaries set, UAT becomes a guided exploration, ensuring that every step aligns with user needs and expectations.
Involving end-users and stakeholders
End-users aren’t just passengers on this UAT journey; they are its navigators. Involving end-users and stakeholders isn’t a mere formality; it’s the essence of UAT’s success. Their insights, feedback, and experiences paint a vivid picture of what the software needs to be. With their fingerprints on the process, UAT evolves from a technical test to a user-centric voyage.
Realistic scenario creation for testing
UAT isn’t a robotic repetition of steps; it’s an intricate dance of real-life scenarios. Creating scenarios that mimic actual user interactions is the heartbeat of UAT’s effectiveness. This process delves into the essence of user journeys, simulating the highs and lows they encounter. These scenarios become the canvas on which UAT paints a masterpiece of user-friendliness and functionality.
Addressing security and data privacy concerns
In a digitized world, security and data privacy are non-negotiable. UAT doesn’t merely ensure software functionality; it safeguards user trust. Addressing security concerns means fortifying the software against vulnerabilities. It’s a commitment to building a fortress of reliability where user data is protected and user confidence is upheld.
Business Analysts (BA) are expected to perform UAT testing. Become a great BA with the Business Analyst Work Experience Program
User Acceptance Testing (UAT) isn’t just a phase; it’s a gateway to software excellence that resonates with end-users. To harness the full potential of UAT, a set of best practices emerge as guiding lights, ensuring a user-centric and flawless software journey.
Collaborative approach between development and testing teams
The synergy between development and testing teams isn’t just essential; it’s the backbone of UAT success. A collaborative approach fosters a shared understanding of objectives, challenges, and solutions. Development teams provide insight into technical intricacies, while testing teams offer user perspective. This alliance ensures that UAT isn’t a standalone event but a harmonious symphony of expertise.
Examples of creating comprehensive UAT test cases
UAT isn’t guesswork; it’s a systematic exploration. Crafting comprehensive test cases paves the way for this exploration. These test cases are more than mere steps; they’re roadmaps that guide end-users through the software landscape. Each test case reflects a user scenario, ensuring that no corner of the software remains untested. This comprehensive approach eradicates guesswork and ensures that user experiences mirror the intended outcomes.
Test Case ID
Test Scenario
Test Steps
Expected Outcome
Pass/Fail
UAT_TC01
User Registration
1. Navigate to the registration page.
Successful registration with a unique username and password.
2. Fill in valid user information.
A confirmation message and email are received.
3. Submit the registration form.
User is registered and can log in.
UAT_TC02
Product Purchase
1. Log in using valid credentials.
Successful login.
2. Browse the product catalog.
Products are displayed accurately.
3. Add a product to the cart.
Product is added to the cart.
4. Proceed to checkout.
Checkout process is smooth and error-free.
5. Complete the payment process.
Payment is successful, and a confirmation is received.
UAT_TC03
Account Settings Update
1. Log in using valid credentials.
Successful login.
2. Navigate to account settings.
Account settings page is accessible.
3. Update email address or password.
Changes are saved and confirmed.
4. Save the changes.
User receives a notification of successful update.
UAT_TC04
Content Publishing
1. Log in with appropriate credentials.
Successful login.
2. Navigate to content creation section.
Content creation interface is accessible.
3. Create a new article or post.
Content is created and saved without errors.
4. Add relevant media (images or videos).
Media is added and displayed correctly within the content.
5. Publish the content.
Content is published and visible to users.
UAT_TC05
Search Functionality
1. Access the search feature on the website.
Search bar is present and functional.
2. Enter relevant keywords.
Search results match the entered keywords.
3. Review displayed search results.
Results include relevant content and are organized logically.
4. Click on a search result.
User is directed to the selected content.
Real-world scenario simulation
UAT isn’t confined to sterile labs; it thrives in the real world. Simulating real-world scenarios elevates UAT from a technical process to a user-centric adventure. The software isn’t tested in isolation; it’s evaluated as users would engage with it. This simulation injects authenticity into the UAT process, addressing potential hiccups and ensuring a seamless user journey.
Incorporating end-user feedback
End-users aren’t passive recipients; they’re active participants in UAT’s success. Their feedback isn’t a footnote; it’s a cornerstone. Incorporating end-user feedback polishes the software, ironing out wrinkles that only users can uncover. This practice transforms UAT from a one-time event to an iterative process, driving continuous improvement and fine-tuning user experiences.
Business Analysts (BA) are expected to perform UAT testing. Become a great BA with the Business Analyst Work Experience Program
Many companies across various industries have successfully implemented User Acceptance Testing (UAT) as a crucial step in their software development process. Here are a few notable examples:
Apple: Apple extensively uses UAT for testing new software releases, ensuring that their products meet the high standards expected by their users. This includes both macOS and iOS updates.
Facebook: Social media giant Facebook employs UAT to validate new features and changes to their platform before they are rolled out to millions of users, ensuring a smooth user experience.
Microsoft: Microsoft incorporates UAT in the development of its software products, such as the Windows operating system and Office suite. This helps them identify and address issues before widespread release.
Amazon: E-commerce giant Amazon utilizes UAT to test new features and enhancements on their website and mobile apps. This helps them maintain a seamless shopping experience for their customers.
Google: Google employs UAT to test updates and new features for their suite of products, including Google Workspace (formerly G Suite) and Android operating system.
Salesforce: As a leading customer relationship management (CRM) platform, Salesforce implements UAT to validate new features and customizations before they are available to their users.
Netflix: Streaming giant Netflix uses UAT to ensure a glitch-free experience for their subscribers when rolling out new app versions and features.
Uber: Ride-sharing company Uber employs UAT to thoroughly test updates and new features in their app to provide a reliable and user-friendly service.
Airbnb: Airbnb utilizes UAT to validate changes to their platform, ensuring that hosts and guests have a smooth experience when using the website and app.
Adobe: Adobe employs UAT to test updates and enhancements to their creative software products like Photoshop, Illustrator, and Premiere Pro.
These companies, among many others, recognize the importance of UAT in delivering software and services that meet user expectations, enhance user satisfaction, and maintain their reputation for quality and reliability.
UAT and Agile Development
In the dynamic landscape of software development, agility has emerged as the guiding principle for innovation. The integration of User Acceptance Testing (UAT) within Agile methodologies has given rise to a symbiotic relationship that propels the development process towards excellence. This fusion not only accelerates software delivery but also enhances user satisfaction through a continuous cycle of testing and refinement.
Integrating UAT within Agile methodologies
Agile methodologies, characterized by their iterative and incremental approach, emphasize adaptability and collaboration. Integrating UAT seamlessly aligns with these principles, infusing the development cycle with user-centricity. In Agile, UAT is not an isolated event at the end of development but an ongoing process. As each iteration progresses, UAT becomes a checkpoint where user feedback is sought and incorporated, steering the software towards alignment with user needs. The use of acceptance criteria in the agile software development process makes for the inclusion of UAT like verifications.
There are two choices to integrate UAT as part of Agile:
You treat it as “release to production” and the Product Owner contacts the users or Business Analyst to test the functionality in UAT.
You treat it as part of the development. Then it should be in Definition of Done, and it should be part of the Product Backlog Item’s flow to “Done” i.e. To Do -> In Progress -> UAT -> Done.
UAT’s role in continuous delivery and frequent releases
Agile’s hallmark is continuous delivery and frequent releases. UAT plays a pivotal role in ensuring that these releases are not just swift but also polished. With UAT as a recurring step, each release undergoes meticulous user scrutiny. This process is a buffer against the introduction of defects and glitches, safeguarding the user experience. As Agile embraces change, UAT steps in to validate changes, making certain that they resonate positively with users.
The team’s Definition of Done should be such that downstream activities, such as integration or user acceptance testing, complete successfully. If the result of user acceptance testing is that the product is not acceptable, the team should understand why and make changes to their way of working to regularly create Increments that are likely to be acceptable. Any other feedback from UAT can be treated like customer or user feedback and ordered with the rest of the Product Backlog.
By removing external dependencies, you no longer need to worry about how to estimate or plan for these external dependencies during refinement or Sprint Planning events.
Moreover, UAT’s involvement in the Agile cycle nurtures a culture of collaboration. Developers, testers, and end-users converge, where user feedback shapes the software’s evolution. This real-time engagement refines the software, nurturing a product that evolves organically with user needs.
Business Analysts (BA) are expected to perform UAT testing. Become a great BA with the Business Analyst Work Experience Program
Frequently asked questions about User Acceptance Testing UAT
What is user acceptance testing UAT and how it works?
User Acceptance Testing (UAT), or software testing from the point of view of the users, is usually the final stage of any software development lifecycle (SDLC) before going live. UAT is the final stage of the development process to determine that the software does what it was designed to do according to the requirements originally stated.
What is UAT vs QA testing?
UAT and QA both involve testing. However, they have different objectives. The difference is that the QA teams work to ensure error-free software whereas UAT ensures that end users get the product they want. QA teams generally perform system integration testing while business analysts perform UAT.
What is UAT in agile?
UAT, or user acceptance testing, is the final stage in the software testing process. In Agile as well as waterfall projects, it is typically performed by the end-users, clients or business analysts to determine whether an application or feature fulfills its purpose. UAT must be completed before the software can be released to the market. UAT can be performed within a sprint or before a production release.
What tool is used for UAT?
With the help of Selenium, testers can automate the acceptance tests, ensuring that the application meets the requirements of the end users. However, it’s important to note that Selenium alone may not be sufficient for all aspects of UAT and may need to be combined with other tools for a complete UAT solution. JIRA is also typically used to manage and maintain test cases.
What is UAT in DevOps?
User acceptance testing (UAT) is the last phase of the software testing process. During UAT, actual software users test the software to make sure it works as per real-world scenarios, and according to the requirements. DevOps incorporates the practice of UAT to allow for seamless delivery of high quality software products.
Who prepares UAT?
User acceptance testing is performed by business analysts, clients or the end-users. They will write a complete UAT test plan, prepare a UAT environment that mirrors production, write corresponding UAT test cases, execute these test cases, report defects if any, verify the fixes to the defects raised and finally confirm that the software is fit for use.
Is UAT part of Agile?
UAT is included in the agile framework, and should be part of the sub tasks for each use story in the product backlog. A user story describes a user, the feature they want to use, and how it helps them achieve their goal, and the UAT tests should describe an explain the acceptance criteria.
Who manages UAT in Agile?
This could be the Business Analyst or Product Owner. But because the ability to produce a “Done” increment would be so tightly coupled to this process, a Development Team should certainly take an interest in making sure UAT takes place at the right time and in the right way to maximize what they are able to achieve.
A gap analysis is a strategic planning tool used to identify the difference (“gap”) between the current state and the desired future state of a business or project. It helps organizations understand where they are currently, where they want to be, and what steps are needed to bridge the gap between the two.
Overview of the Gap Analysis
Gap analysis – Look for gaps in processes and technologies
Gap analysis is a systematic approach to assess the current state of the organization or project and compare it to the desired future state. The analysis helps identify discrepancies or “gaps” between the two states, enabling the organization to plan and strategize for improvement.
The purpose is to understand the current performance, capabilities, or status of the organization or project in relation to its desired goals. The main objectives of the gap analysis may include:
Identifying areas of improvement: Determine which aspects of the organization or project require enhancement to meet the desired objectives and performance levels.
Setting realistic targets: Establish specific, measurable, achievable, relevant, and time-bound (SMART) targets to bridge the identified gaps.
Formulating actionable strategies: Develop strategies and action plans to address the identified gaps and improve the overall performance.
Aligning with strategic goals: Ensure that the organization or project is aligned with its strategic objectives and long-term vision.
The gap analysis is usually performed by the business analyst or product manager. Learn more about the role of the business analyst here.
Become a Business Analyst with Work Experience and secure your career as a BA
Identify Goals and Criteria: Clearly define the organization’s goals and objectives. Establish measurable criteria or key performance indicators (KPIs) that will be used to assess the current state and measure progress towards the desired future state.
Assess Current State: Gather data and information about the organization’s current performance and capabilities. Compare the current state against the predefined criteria to identify gaps and areas where the organization falls short of its goals.
Define Future State: Envision the desired future state of the organization. Set specific, achievable, and time-bound targets aligned with the organization’s strategic vision. This step serves as the benchmark for assessing progress during the analysis.
Analyze and Interpret Gaps: Analyze the gaps between the current state and the future state. Identify the root causes and contributing factors to the gaps, considering both internal and external factors that influence performance.
Develop Action Plan: Create an action plan to bridge the identified gaps. Propose strategies, initiatives, and solutions to address weaknesses and capitalize on opportunities. Establish a timeline, allocate resources, and assign responsibilities for implementing the action plan. Regularly monitor progress and adjust strategies as needed to achieve the desired future state.
The need to perform gap analysis / application of gap analysis / types of gap analysis
Goal Alignment: Gap analysis helps align an organization’s objectives with its actual performance. It ensures that the organization’s goals are realistic, achievable, and grounded in the current capabilities and resources.
Performance Evaluation: It provides an objective evaluation of an organization’s current state, including strengths, weaknesses, and areas for improvement. This evaluation is crucial for understanding where the organization stands in comparison to its desired future state.
Strategic Planning: Gap analysis is an essential component of strategic planning. It helps organizations identify the gaps between their current position and their strategic vision. This information is critical for formulating effective strategies to bridge those gaps and achieve long-term success.
Resource Optimization: By identifying gaps, organizations can optimize the allocation of resources. It allows them to prioritize areas that require immediate attention and allocate resources efficiently for the most impactful outcomes.
Decision-Making: Gap analysis provides a data-driven basis for decision-making. It helps leaders and stakeholders make informed choices about resource allocation, investments, and strategic initiatives.
Risk Management: Understanding gaps and weaknesses helps organizations identify potential risks and vulnerabilities. Addressing these gaps proactively can minimize risks and prevent potential issues from escalating.
Continuous Improvement: Gap analysis fosters a culture of continuous improvement within the organization. It encourages regular assessment and adjustment of strategies to adapt to changing circumstances and remain competitive.
Customer-Centric Approach: For businesses, gap analysis helps in understanding customer needs and expectations. By identifying gaps in customer satisfaction and experience, organizations can tailor their products and services to meet customer demands effectively.
Performance Measurement: Gap analysis provides a benchmark for measuring progress and success. Organizations can track their improvements over time and evaluate the effectiveness of their initiatives.
Compliance and Regulatory Requirements: In regulated industries, gap analysis helps organizations ensure compliance with industry standards, laws, and regulations. It allows them to identify and address gaps in meeting these requirements.
Scope of the gap analysis
The gap analysis will have its scope defined, including what aspects of the organization or project will be covered and what will be excluded. The scope may include specific departments, processes, systems, or functions. Be sure to clarify the boundaries and limitations of the analysis to manage expectations.
Inclusions: Clearly state what will be covered in the gap analysis, such as financial performance, operational efficiency, customer satisfaction, or specific project deliverables.
Exclusions: Specify what will not be part of the analysis to avoid any misunderstandings. For instance, it might be necessary to exclude certain factors that are not within the scope of the current project.
Timeframe: Mention the time period for which the analysis will be conducted. It could be the current fiscal year, a specific quarter, or a certain phase of the project.
Data Sources: Describe the data sources that will be used to gather information for the analysis. These may include internal reports, interviews, surveys, or external benchmarks.
Constraints: Highlight any constraints or limitations that may affect the analysis, such as resource availability, time constraints, or data accessibility.
Gap analysis offers several benefits to organizations and projects:
Identifies Opportunities for Improvement: Gap analysis helps organizations identify areas where they are falling short of their goals or desired outcomes. By understanding the gaps between the current state and the future state, organizations can identify specific areas for improvement and growth.
Sets Clear Objectives: Gap analysis sets clear and measurable objectives for the organization or project. It defines the target outcomes and provides a roadmap for achieving them, enabling better focus and direction for the team.
Optimizes Resource Allocation: By identifying areas with significant gaps, gap analysis allows organizations to prioritize resource allocation. It ensures that resources such as time, budget, and manpower are allocated to the most critical areas for improvement.
Enhances Decision-Making: Gap analysis provides a data-driven basis for decision-making. It helps leaders and stakeholders understand the potential risks, benefits, and impacts of various choices and strategies.
Encourages Continuous Improvement: Gap analysis is a continuous process, and organizations can regularly assess their progress and adjust strategies accordingly. It fosters a culture of continuous improvement and adaptation to changing circumstances.
Aligns Objectives with Strategy: By defining the future state and comparing it with the current state, gap analysis ensures that objectives are closely aligned with the organization’s strategic vision. It helps ensure that efforts are directed towards achieving the organization’s long-term goals.
Promotes Accountability: Gap analysis assigns responsibilities and accountabilities for bridging the identified gaps. It clarifies who is responsible for what tasks, improving accountability and ownership among team members.
Increases Efficiency and Productivity: Addressing identified gaps often involves streamlining processes and eliminating inefficiencies. This leads to increased overall efficiency and productivity in the organization.
Mitigates Risks: Gap analysis helps identify potential risks and challenges that may hinder progress. By addressing these risks proactively, organizations can reduce the likelihood of negative outcomes.
Boosts Competitive Advantage: By identifying and addressing gaps, organizations can gain a competitive advantage in the market. They can differentiate themselves by offering superior products, services, or processes compared to their competitors.
Techniques used to perform gap analysis
Several techniques are used to perform gap analysis, depending on the context and the specific requirements of the analysis. Some commonly used techniques include:
SWOT Analysis: SWOT (Strengths, Weaknesses, Opportunities, Threats) analysis is a widely used technique to assess the internal strengths and weaknesses of an organization and external opportunities and threats it faces. By comparing strengths and weaknesses to opportunities and threats, gaps can be identified, and strategies can be developed to address them.
SWOT Analysis template
Benchmarking: Benchmarking involves comparing an organization’s performance metrics with those of industry peers or best-in-class companies. It helps identify performance gaps and highlights areas where the organization lags behind or excels, providing insights for improvement.
Performance Metrics Analysis: This technique involves analyzing key performance indicators (KPIs) and other relevant metrics to assess an organization’s current performance against predefined targets or industry benchmarks. Any gaps between the current and desired performance levels can be identified and addressed.
Customer Feedback and Surveys: Collecting feedback from customers through surveys, interviews, or focus groups can help identify gaps in customer expectations and experiences. Customer feedback is crucial for understanding areas where the organization needs to improve to better meet customer needs.
Process Mapping: Process mapping visually represents the current processes within an organization, helping to identify inefficiencies, bottlenecks, and areas of improvement. Comparing the current process with the desired future state can reveal gaps that need to be addressed.
Capability Maturity Model (CMM): CMM is a framework used to assess and improve the maturity level of an organization’s processes. By comparing the organization’s current maturity level to the desired level, gaps in process maturity can be identified.
Gap Analysis Surveys and Questionnaires: Specific surveys and questionnaires can be designed to gather targeted information about various aspects of the organization’s operations. The results can then be compared to ideal or desired conditions to uncover gaps.
Cost-Benefit Analysis: Cost-benefit analysis helps evaluate the financial impact of different strategies and initiatives. It can be used to compare the cost of implementing improvements against the potential benefits to identify the most cost-effective solutions.
Risk Analysis: Analyzing potential risks and vulnerabilities can help identify gaps in risk management practices. This analysis enables organizations to develop risk mitigation strategies and improve their resilience.
Employee Feedback and Stakeholder Interviews: Gathering feedback from employees and stakeholders within the organization can provide valuable insights into operational challenges and potential gaps that need to be addressed.
The choice of technique(s) for gap analysis depends on the organization’s goals, available data, and the complexity of the analysis. Often, a combination of these techniques is used to gain a comprehensive understanding of the gaps and develop effective strategies for improvement.
Be sure to provide a comprehensive description of the current state of the organization or project. Include details about its current structure, processes, systems, and overall performance. Describe the organization’s current position in the market, its products or services, and any recent developments or changes that have taken place.
Define Key Performance Indicators (KPIs) and Metrics, Current State and Issues
Identify and present the key performance indicators (KPIs) and metrics that are used to measure the current state. KPIs may vary based on the organization’s goals and objectives, but they should be relevant to the specific scope of the gap analysis. Common KPIs may include financial metrics (e.g., revenue, profitability), operational metrics (e.g., efficiency, productivity), customer metrics (e.g., satisfaction, retention), and quality metrics (e.g., defects, errors).
Assess and outline the strengths and weaknesses of the organization or project’s current state. Consider both internal and external factors that influence its performance. Strengths may include areas where the organization excels, such as strong brand reputation, efficient processes, or a talented workforce. Weaknesses may include areas of concern, such as outdated technology, inefficient workflows, or limited market share.
Identify and highlight any significant issues or challenges that are affecting the current state. These may include obstacles that hinder progress, obstacles that prevent the organization from reaching its goals, or issues that have the potential to cause significant impact. It’s essential to be specific and provide evidence or data to support the identified issues and challenges.
Future State Definition
Ensure that describe the desired future state of the organization or project. Paint a detailed picture of what the organization aims to achieve in terms of its structure, processes, capabilities, and overall performance. Explain how the future state aligns with the organization’s long-term vision and strategic objectives.
Outline the specific goals, objectives, and targets that the organization aims to accomplish in the future state. Goals are broad, high-level statements of what the organization wants to achieve. Objectives are more specific and measurable outcomes that contribute to the achievement of the goals. Targets are quantifiable metrics or milestones used to track progress toward the objectives.
For example:
Goal: Increase customer satisfaction and loyalty.
Objective: Improve customer service response time by 30%.
Target: Achieve a customer satisfaction rating of 90% by the end of the next quarter.
Explain the organization’s vision for the future state and how it fits into the broader strategic direction. The vision should be a clear and inspiring statement of the organization’s long-term aspirations and what it aims to become. Describe how the future state aligns with the organization’s overall strategy and how it supports growth, innovation, or market expansion.
With the above done, you will not be able to conduct a detailed comparison between the current state (as described in Section II) and the desired future state (as outlined in Section III). Identify the gaps or differences between the two states in terms of processes, capabilities, performance, and any other relevant aspects. Use visual aids such as tables or diagrams to present the comparison clearly.
If feasible, quantify the gaps between the current and future states using the key performance indicators (KPIs) and metrics identified in Section II. Provide numerical values to represent the differences and demonstrate the extent of improvement required to reach the future state targets. Quantifying the gap helps in prioritizing areas for improvement and sets a clear target for each identified gap.
For example:
Current State: Customer satisfaction rating of 75%.
Future State Target: Customer satisfaction rating of 90%.
Gap: 15 percentage points.
Subsequently, delve into the root causes behind each identified gap between the current and future states. Use various analytical techniques, such as brainstorming, cause-and-effect diagrams (Ishikawa or Fishbone diagrams), or 5 Whys analysis, to identify the underlying reasons for the gaps. Understanding the root causes is critical for devising effective solutions and action plans.
Fishbone diagram for root cause analysis
For example:
Gap: Customer service response time not meeting the future state target.
Root Causes: Insufficient staff training, outdated technology, and lack of automated response systems.
Identify and analyze the internal factors within the organization that contribute to the gaps between the current and future states. These factors are within the organization’s control and can be influenced through strategic decisions and actions. Some examples of internal factors include:
Processes: Assess the efficiency and effectiveness of existing processes. Identify any bottlenecks, redundancies, or gaps in the workflows that hinder progress towards the future state.
Systems and Technology: Evaluate the organization’s current technological infrastructure and tools. Determine whether the existing systems support the desired future state requirements or if upgrades are necessary.
Resources: Examine the availability and allocation of resources, including human resources, financial capital, and equipment. Determine whether the organization has the necessary resources to achieve the future state objectives.
Skills and Training: Assess the skill sets and capabilities of the workforce. Identify any gaps in skills and knowledge that may hinder the organization from reaching the future state targets.
Identify and analyze the external factors that contribute to the gaps between the current and future states. These factors are outside the direct control of the organization but can significantly influence its performance and success. Some examples of external factors include:
Market Trends: Analyze current and emerging market trends, consumer preferences, and industry developments. Identify how these trends impact the organization’s ability to achieve its future state objectives.
Competitor Analysis: Evaluate the strengths and weaknesses of competitors and how they compare to the organization’s capabilities. Identify areas where the organization lags behind or can gain a competitive advantage.
Regulatory Changes: Assess how changes in laws, regulations, or industry standards may impact the organization’s operations and ability to meet the future state requirements.
Economic Factors: Consider economic conditions, such as inflation, interest rates, and market stability, that can influence the organization’s financial performance and ability to invest in future state initiatives.
Risks of not addressing the gap and Opportunities of having addressed the gap
Risks of not addressing the gap
Identify and assess the potential risks and negative consequences that the organization may face if the gaps between the current and future states are not addressed. Failure to bridge the gaps could lead to various challenges, setbacks, and missed opportunities.
Some common risks associated with not addressing the gap include:
Loss of Competitive Advantage: Not achieving the desired future state may result in the organization losing its competitive edge and market position.
Customer Dissatisfaction: Failure to meet customer expectations and demands may lead to decreased customer satisfaction and loyalty.
Inefficient Processes: Unaddressed gaps in processes may lead to inefficiencies, increased costs, and operational inefficiencies.
Financial Losses: Failure to achieve the future state objectives may lead to financial losses, missed revenue opportunities, and increased costs.
Employee Disengagement: Lack of progress towards the desired future state may impact employee morale and engagement.
Compliance and Legal Issues: Failure to meet regulatory requirements or address changes in compliance standards could lead to legal or reputational risks.
Opportunities Gained from Addressing the Gap
Highlight the potential opportunities and positive outcomes that the organization can gain by addressing the identified gaps. Successfully bridging the gaps can lead to several advantages and benefits. Some opportunities gained from addressing the gap include:
Increased Market Share: Achieving the desired future state may lead to increased market share and a larger customer base.
Enhanced Customer Experience: Meeting customer expectations and delivering on the desired future state can lead to improved customer experience and loyalty.
Improved Efficiency and Productivity: Addressing process gaps can lead to streamlined workflows and increased efficiency.
Cost Savings: Closing gaps in operations can lead to cost savings and better resource allocation.
Innovation and Differentiation: Successfully implementing future state initiatives can lead to innovation and differentiation from competitors.
Attracting Talent: Progressing towards the desired future state can enhance the organization’s reputation and attractiveness to potential employees.
In this section, present the recommended strategies and approaches to bridge the gaps between the current state and the desired future state. Each strategy should directly address the identified gaps and align with the organization’s goals and objectives. Consider both short-term and long-term strategies that will lead to sustainable improvements. Clearly explain the rationale behind each proposed strategy and how it contributes to achieving the future state.
Action Plan with Specific Steps and Milestones
Outline a detailed action plan that lays out the specific steps and milestones required to implement the recommended strategies. The action plan should be well-structured, sequential, and time-bound. Include responsible parties or teams for each action, along with expected completion dates for each milestone. This ensures clear accountability and helps track progress throughout the implementation process.
Identify the resource requirements needed to execute the action plan effectively. These resources may include financial investments, human resources, technological upgrades, or external expertise. Quantify the estimated costs associated with each strategy and provide a budget for the entire implementation process. Ensure that the organization has the necessary resources to support the gap-closing initiatives.
Risk Mitigation Plan for Implementing Solutions
Outline the risk mitigation plan to address potential challenges and obstacles that may arise during the implementation of the recommended solutions. Identify key risks and uncertainties, along with their potential impact on the success of the gap-closing initiatives. For each risk, propose specific mitigation strategies to reduce or eliminate its negative effects. The risk mitigation plan helps ensure a smoother implementation process and minimizes disruptions.
Implementation Plan of the Gap Analysis
Timeline and Sequence of Activities
Provide a detailed timeline and sequence of activities for the implementation of the proposed strategies and action plan. Break down the action plan into smaller tasks or phases, and assign estimated start and end dates for each activity. Ensure that the timeline is realistic and considers any dependencies or interrelationships between tasks. Include milestones to track progress and celebrate achievements.
Roles and Responsibilities in performing a Gap Analysis
Identify and assign specific roles and responsibilities to individuals or teams involved in the implementation process. Clearly define who will be accountable for each task, who will be responsible for executing it, and who will be consulted or informed. Ensuring clear roles and responsibilities helps streamline communication and decision-making during the implementation phase.
For example:
Project Manager: Overall coordination and management of the implementation plan.
Department A Team: Responsible for implementing Strategy 1 and Strategy 2.
Department B Team: Responsible for implementing Strategy 3 and Strategy 4.
Finance Department: Responsible for budget allocation and financial oversight.
Senior Management: Decision-makers and sponsors for the implementation process.
Communication and Stakeholder Engagement Plan
Outline a communication and stakeholder engagement plan to ensure effective communication with all relevant stakeholders throughout the implementation process. Identify key stakeholders, such as employees, management, customers, suppliers, or external partners, and determine the appropriate communication channels and frequency of updates.
The communication plan should include:
Regular progress updates to stakeholders on the status of implementation.
Channels of communication (e.g., meetings, emails, progress reports, presentations).
Stakeholder engagement activities to involve them in the process and address any concerns.
A feedback mechanism to capture suggestions or concerns from stakeholders.
Monitoring and Evaluation of the Gap Analysis project
Key Performance Indicators to Measure Progress
Identify the key performance indicators (KPIs) that will be used to monitor and measure the progress of the implementation plan. These KPIs should be aligned with the objectives and targets set in Section III and should reflect the organization’s priorities. The selected KPIs should be specific, measurable, achievable, relevant, and time-bound (SMART).
For example:
KPI: Customer satisfaction rating.
Target: Achieve a customer satisfaction rating of 90% by the end of the next quarter.
Progress: Monitor customer satisfaction scores on a monthly basis and compare them against the target.
Evaluation Criteria for Success:
Define the criteria that will be used to determine the success of the implementation plan. These criteria should be based on the achievement of the desired future state and the objectives set in Section III. The evaluation criteria should be clear, objective, and aligned with the organization’s overall goals.
For example:
Criterion: Increase in market share.
Success: Achieving a market share growth of 5% within the next six months.
Review Mechanisms and Frequency
Outline the review mechanisms and the frequency of evaluation to assess the progress of the implementation plan. Determine when and how progress will be reviewed, who will be involved in the review process, and the format of the review meetings or reports.
For example:
Monthly Progress Review: Hold monthly meetings with the project team to review the progress, discuss challenges, and make necessary adjustments to the implementation plan.
Quarterly Performance Review: Conduct quarterly evaluations to assess the achievement of targets and alignment with the desired future state.
Conclusion
Gap analysis is a valuable tool that supports decision-making, goal-setting, and continuous improvement efforts. It provides organizations with a systematic approach to identify and address challenges, maximize opportunities, and ultimately drive success and growth. It is a valuable tool for organizations seeking to make informed decisions, align their strategies with their objectives, and continuously improve their performance. It enables organizations to bridge the gap between their current state and their desired future state, driving growth, efficiency, and competitiveness.
A gap analysis is performed to recognize an organization’s current state—by mapping processes, activities and measuring time, money, and labor—and comparing it with its desired state. By defining and analyzing these gaps between the desired state and the current state, the project team can create an action plan to move the organization forward and fill in the gaps.
Why is gap analysis important?
Gap analysis helps organizations set clear objectives, optimize resource allocation, and make informed decisions. It promotes continuous improvement and ensures alignment with strategic goals.
What is a gap analysis also known as?
A gap analysis is also called a needs analysis and is important for ongoing improvement of the performance of any organization.
How do you write a gap analysis example?
1. Identify the organizational area to be analyzed. 2. Identify the goals to be accomplished. 3. State the ideal future state. 4. Analyze the current state. 5. Compare the current state with the ideal future state. 6. Describe the gap and quantify the difference. 7. Create a plan of action (project) to bridge the gap.
What are the techniques used in gap analysis?
Techniques include SWOT analysis, benchmarking, performance metrics analysis, customer feedback, process mapping, CMM, cost-benefit analysis, risk analysis, and surveys.
Is a SWOT analysis a gap analysis?
SWOT analysis is a technique used while performing a gap analysis. Using a SWOT analysis diagram is one of the ways to take understanding where an organization stands, its current state position in the competitive landscape, what it is doing well, and what it could be doing better.
What is the value of gap analysis?
A gap analysis is a good way to determine and move to a higher state of organizational productivity. By evaluating ongoing performance, inputs and outputs, and comparing these to desired higher states, one is able to determine the difference and work out ways to navigate that gap.
Who should perform gap analysis?
Business analysts are usually the ones who undertake gap analyses to determine how to make improvements. The gap analysis can be applied to performance of a department or team, an individual, or the entire company. Whenever there are growth goals, or existing objectives are not met, it is an indicator to discover what may be getting in the way through a gap analysis.
How does gap analysis benefit decision-making?
Gap analysis provides data-driven insights that assist in making informed decisions about resource allocation, investments, and strategic initiatives.
What are the three 3 fundamental components of a gap analysis?
The three fundamental components of a gap analysis are the current state, desired state, and the gap. A gap analysis is used in organizations to help them understand the differences between their current and desired state. By understanding this, they can work on strategies to help close the gaps.
What role does gap analysis play in strategic planning?
Gap analysis helps identify gaps between the current state and the strategic vision, enabling the development of effective strategies to bridge those gaps.
How does gap analysis support continuous improvement?
By regularly assessing progress and adapting strategies, gap analysis fosters a culture of continuous improvement and adaptation to changing circumstances.
How does gap analysis help organizations prioritize improvements?
Gap analysis prioritizes areas requiring immediate attention, optimizing the allocation of resources for the most impactful outcomes.
What are the potential risks of not conducting gap analysis?
Without gap analysis, organizations may lack direction, miss growth opportunities, and face operational inefficiencies due to a lack of focus on key improvement areas.
Can gap analysis be used in various industries?
Yes, gap analysis is applicable across industries, from business and healthcare to education and technology, as it provides a universal framework for improvement.
What is the outcome of gap analysis?
The outcome of gap analysis is a comprehensive report highlighting identified gaps, recommended solutions, and a roadmap for achieving the desired future state.
Project management is an excellent career option for individuals who enjoy leading teams, organizing tasks, and driving successful outcomes. It involves planning, executing, and controlling projects to achieve specific goals within defined constraints such as time, budget, and resources.
Project management jobs in the United States are available across various industries and sectors. The demand for skilled project managers remains consistently high as organizations strive to execute projects efficiently and achieve their strategic objectives.
INDUSTRIES WITH THE HIGHEST LEVELS OF EMPLOYMENT IN THIS OCCUPATION
While project management is a versatile skill that is applicable across various industries, here are some industries known to have high levels of employment in project management roles:
Information Technology (IT): IT companies often have a significant number of projects, ranging from software development to infrastructure upgrades, which require project management expertise to ensure successful execution.
Construction: Construction projects, such as building infrastructure, residential and commercial buildings, and civil engineering projects, require project managers to oversee planning, coordination, and execution.
Engineering: Engineering firms involved in sectors like civil, mechanical, electrical, and industrial engineering rely on project managers to lead and manage complex engineering projects.
Healthcare: The healthcare industry, including hospitals, clinics, and medical research organizations, employs project managers to oversee the implementation of new systems, process improvements, and regulatory compliance projects.
Financial Services: Banks, insurance companies, and financial institutions often undertake projects related to new product launches, system upgrades, regulatory changes, and process improvements, all requiring project management expertise.
Manufacturing: Manufacturing companies often undertake projects for process optimization, new product development, equipment upgrades, and facility expansions, necessitating project management skills.
Consulting: Project management consulting firms provide project management services to clients across various industries, enabling them to effectively execute projects and achieve their objectives.
Government: Government organizations at different levels (local, state, and federal) undertake projects related to infrastructure development, public services, policy implementation, and more, all requiring project management expertise.
It’s worth noting that project management skills are in demand in many other industries as well, including telecommunications, energy, marketing and advertising, retail, and nonprofit organizations, among others. The specific industries with the highest levels of employment in project management can vary depending on geographic location and economic factors.
Emergency management directors prepare plans and procedures for responding to natural disasters or other emergencies. They also help lead the response during and after emergencies.
Public relations managers direct the creation of materials that will enhance the public image of their employer or client. Fundraising managers coordinate campaigns that bring in donations for their organization.
Frequently Asked Questions about project management jobs in the United States
What is the role of a project manager?
The project manager is the individual accountable for delivering the project. They lead and manage the project team, with authority and responsibility vested in them by the organization through the project charter, to run the project on a day-to-day basis and utilize organization resources.
Is project manager an IT job?
The project manager role exists in information technology (IT) and in other sectors as well. An IT project manager helps organizations achieve their IT goals by planning and executing projects. They lead projects to introduce new software solutions, improve efficiency, scale business processes, and more.
Who can be project manager?
Professionals with skills and experience in a project management, people management and business management can be a project manager. As you gain experience, the scope of your work and responsibilities may increase in terms of project size and complexity.
Do project managers need IT skills?
Project managers need IT skills irrespective of the sector they work in. Most project today are planned, executed and monitored with the use of a software system like MS Projects, Atlassian JIRA or Asana. Managers in the IT sector need greater domain understanding and technology comprehension to ensure that their project deliver the IT needs of the organization. Those working in IT project management have a thorough knowledge of IT, possess a well-rounded skill set and are aware of current trends.
Is project manager job difficult?
Project management is a challenging career as no day will be the same, and you will need all your project management skills to solve problems. Also, you’ll be the first person your team goes to when a problem occurs. They might expect you to hold the answers to any inquiry.
Can a fresher become project manager?
With the right qualifications, skills, and mindset, it is certainly possible for a fresher to become a project manager. Become a project manager by mastering technical project management techniques, business management and leadership skills.
What is the job outlook for project management roles in the United States?
The job outlook for project management roles in the United States is promising, with steady demand across various industries.
What are the typical entry-level positions in project management?
Common entry-level positions in project management include project coordinator, assistant project manager, or project analyst.
How can I gain relevant experience in project management?
Gaining relevant experience in project management can be achieved through internships, volunteering, taking on project-based roles within organizations like the project management work experience program.
Are there any specific industries in the United States that offer strong project management career opportunities?
Industries such as IT, construction, healthcare, and finance offer strong project management career opportunities in the United States.
What are the average salaries for project management professionals in the United States?
Average salaries for project management professionals in the United States range from around $70,000 to $120,000 per year, depending on factors such as experience, location, and industry.
What are the key skills that employers look for in project management candidates?
Employers often seek project management candidates with strong communication, leadership, technical project management, domain specific knowledge, problem-solving, and organizational skills.
Is the Project Manager Work Experience certification beneficial for project management jobs in the United States?
Having a Project Manager Work Experience certification is highly beneficial for project management jobs in the United States, as it demonstrates expertise, experience and conveys your proven capabilities to manage projects.
What are some popular project management software tools used?
Popular project management software tools used include Microsoft Project, JIRA, Asana, and Trello.
How can I advance my project management career in the United States?
Advancing a project management career in the United States can be achieved through continuous learning, obtaining advanced certifications, networking, and taking on increasingly complex projects.
Are there any specific educational requirements for project management jobs?
While a bachelor’s degree is often preferred for project management roles, there is no specific educational requirement, and relevant work experience and certifications are valuable.
What are the typical responsibilities of a project manager?
Typical responsibilities of a project manager include developing project plans, managing budgets and resources, coordinating project teams, monitoring progress, and ensuring project goals are met.
What are the common job titles associated with project management?
Common job titles associated with project management include project manager, program manager, project coordinator, project analyst, scrum master and agile coach.
Are there any industry-specific skills or knowledge that are highly sought after in project management jobs?
Certain industries, such as IT, engineering, and healthcare, may require specific technical skills or domain knowledge relevant to their respective fields in addition to project management expertise.
Is it common for project managers to work with cross-functional or remote teams?
Yes, it is common for project managers to work with cross-functional teams and remote teams, particularly with the rise of virtual collaboration tools and remote work practices.
What are the typical career advancement opportunities for project management professionals?
Career advancement opportunities for project management professionals may include progressing to senior project management roles, becoming a project management office (PMO) director, or transitioning into executive leadership positions.
How important is professional networking in the project management job market?
Professional networking is highly important in the project management job market, as it can lead to job opportunities, collaborations, and access to valuable industry contacts.
What are the typical interview questions for project management roles?
Typical interview questions for project management roles may include inquiries about previous project experiences, problem-solving skills, conflict resolution abilities, and leadership approaches.
How can I stay updated with the latest trends and developments in project management?
Staying updated with the latest trends and developments in project management can be achieved through attending industry conferences, participating in webinars, reading industry publications, and engaging in professional development activities offered by organizations like the PMI and review articles on the library page.
Machine learning is a subset of artificial intelligence that focuses on developing algorithms and statistical models that enable computers to learn from data without being explicitly programmed. The goal of the machine learning engineer is to create intelligent systems that can make predictions, recognize patterns, and make decisions based on data.
It is important career-wise to become an expert in machine learning because it is a rapidly growing field with high demand for skilled professionals. Companies across industries are using machine learning to develop new products, optimize processes, and improve customer experience. As a result, there are many opportunities for those with expertise in this area to work on interesting and challenging projects and earn competitive salaries. Additionally, machine learning has the potential to transform industries and solve some of the world’s most pressing problems, making it an exciting and rewarding field to be a part of.
In this article we offer you a clear guide to become a machine learning engineer on your own, with additional resources.
Typical job description of a machine learning engineer
A typical job description of a machine learning engineer may include responsibilities like:
Develop and implement machine learning algorithms and models
Design and implement data processing systems and pipelines
Collaborate with cross-functional teams to develop and implement machine learning solutions
Build and deploy machine learning models into production environments
Perform exploratory data analysis and model selection
Evaluate and improve the performance of machine learning models
Stay up-to-date with the latest advancements in machine learning and related technologies
Academic requirements may include:
Bachelor’s or Master’s degree in Computer Science, Statistics, or related field
Experience with machine learning algorithms and techniques (such as deep learning, supervised and unsupervised learning, and reinforcement learning)
Proficiency in programming languages such as Python, R, or Java
Experience with big data technologies such as Hadoop, Spark
Strong analytical and problem-solving skills
Excellent communication and collaboration skills
Ability to work in a fast-paced, dynamic environment
Preferred qualifications may include responsibilities around software development and / or data engineering:
Experience with natural language processing (NLP) and computer vision
Experience with cloud platforms such as AWS, Azure, or Google Cloud
Knowledge of software engineering best practices such as Agile development and DevOps
Recipe to become a machine learning engineer
Take the following steps to realize your career as a machine learning engineer:
Learn the basics of programming: It’s important to have a solid foundation in programming languages such as Python, Java, or C++.
Develop a strong foundation in math and statistics: Understanding calculus, linear algebra, and statistics will help you in developing a deep understanding of machine learning algorithms.
Learn machine learning fundamentals: Start with supervised and unsupervised learning techniques and then move to advanced techniques like deep learning, natural language processing, and computer vision.
Participate in online communities: Join online communities such as Kaggle, GitHub, and Stack Overflow to learn from experts, connect with like-minded individuals, and work on real-world problems.
Gain experience: Consider gaining experience through our pioneering machine learning engineer work experience simulations or applying for internships / entry-level positions to gain practical experience and learn from experienced professionals.
Keep learning: Stay updated with the latest research and advancements in the field by reading research papers, attending conferences, and taking courses.
Attend conferences and workshops: Attend conferences and workshops to learn about the latest trends and techniques in the field like Google Developer Events.
Skills needed to become a machine learning engineer
To be and succeed as a machine learning engineer, you will need to sharpen your skills around:
Programming: Proficiency in at least one programming language such as Python, R, or Java is necessary. You should be able to write clean, efficient, and well-documented code.
Classical machine learning: Knowledge of machine learning algorithms, data preprocessing, feature engineering, model selection, and evaluation is essential.
Statistics and probability: You should have a strong understanding of probability theory, statistical inference, and regression analysis.
Deep learning: Familiarity with deep learning frameworks like PyTorch, TensorFlow or Keras is important for developing and deploying deep learning models.
ML design patterns: Familiarity with common design patterns like ensembling and transfer learning is much needed in today machine learning landscape.
Problem-solving and critical thinking: Machine learning engineers should be able to think critically and solve complex problems.
Communication and collaboration: Good communication skills are important for working with cross-functional teams and stakeholders.
Continuous learning: The field of machine learning is constantly evolving, and it’s important to stay up-to-date with the latest advancements and techniques.
Gain all the skills you need in our machine learning work experience program along with demonstrable experience and stellar portfolio of your work.
You will learn:
Acquire data from file and API data sources
Perform exploratory data analysis and visualization
Create and setup data processing pipelines
Understand and select appropriate machine learning models for different business situations
Train machine learning models and measure model performance
Optimize machine learning models to deliver the best performance
Train supervised and unsupervised learning models
Train deep learning models
Create multiple machine learning apps!
Use multiple deployment strategies to serve these machine learning models in the cloud
Bonus: perform ML engineering with Google Cloud Platform (GCP) Vertex AI and Cloud Run!
Perform advanced natural language processing and understanding
Utilize large language (LLM) generative AI models: text to text and text to image
Perform computer vision tasks like object recognition
Frequently Asked Questions about Machine Learning Engineering
What is machine learning?
Machine learning is a subset of artificial intelligence that focuses on developing algorithms and statistical models that enable computers to learn from data without being explicitly programmed.
How long does it take to become a machine learning engineer?
Becoming a machine learning engineer can take anywhere between 6 months to a year depending on your ability to devote consistent learning hours, guidance and mentoring that you receive and the tools you learn.
Is it difficult to become a machine learning engineer?
Yes, becoming a machine learning engineer requires knowledge and skills in statistical learning algorithms, computer programming, data management, API development, and cloud / software hosting infrastructure management. While not impossible to master, the learning curve to becoming a machine learning engineer is quite steep.
How do I get into machine learning in the UK?
Get into machine learning by mastering statistical learning algorithms, computer programming, data management, API development, and cloud / software hosting infrastructure management. Upskilling in these areas will offer you ample opportunities to get into machine learning as a data scientist, or a machine learning engineer. Become a Certified Machine Learning Engineer with Experience.
How to become a machine learning engineer in 6 months?
Become a machine learning engineer by mastering statistical learning algorithms, computer programming, data management, API development, and cloud / software hosting infrastructure management. Upskilling in these areas will offer you ample opportunities to get into machine learning as a data scientist, or a machine learning engineer. Become a Certified Machine Learning Engineer with Experience.
Why is there a craze to become an expert in machine learning?
Machine learning is a rapidly growing field with high demand for skilled professionals. It has the potential to transform industries and solve some of the world’s most pressing problems. It also offers interesting and challenging projects and competitive salaries.
What is the typical job description of a machine learning engineer?
A machine learning engineer is responsible for developing and implementing machine learning algorithms and models, designing data processing systems and pipelines, collaborating with cross-functional teams to develop and implement machine learning solutions, building and deploying machine learning models into production environments, performing exploratory data analysis and model selection, evaluating and improving the performance of machine learning models, staying up-to-date with the latest advancements in machine learning and related technologies.
What are the academic requirements for a machine learning engineer?
A bachelor’s or master’s degree in Computer Science, Statistics, or a related field is usually required. Experience with machine learning algorithms and techniques, proficiency in programming languages such as Python, R, or Java, and experience with big data technologies such as Hadoop, Spark are also sometime required. Strong analytical and problem-solving skills, excellent communication and collaboration skills, and the ability to work in a fast-paced, dynamic environment are also essential.
How can I become a machine learning engineer?
To become a machine learning engineer, you can start by learning the basics of programming, developing a strong foundation in math and statistics, learning machine learning fundamentals, working on projects, participating in online communities, gaining experience, and staying updated with the latest research and advancements in the field. You can also consider obtaining relevant education, attending conferences and workshops, and enrolling in the machine learning work experience program.
What skills do I need to become a machine learning engineer?
You will need to sharpen your skills around programming, classical machine learning, statistics and probability, deep learning, ML design patterns, problem-solving and critical thinking, communication and collaboration, and continuous learning. Our machine learning work experience program will provide you with all the skills you need, along with demonstrable experience and a stellar portfolio of your work.
What are some common applications of machine learning?
Machine learning is used in a variety of industries and applications, including: Healthcare: for predicting diseases and personalized treatment plans Finance: for fraud detection and risk assessment Retail: for personalized marketing and product recommendations Manufacturing: for predictive maintenance and quality control Transportation: for optimizing logistics and route planning Natural language processing: for chatbots and virtual assistants
What are some common challenges faced by machine learning engineers?
Some common challenges faced by machine learning engineers include: Data quality and availability: getting access to high-quality, relevant data can be a challenge Overfitting: building models that perform well on training data but not on new, unseen data Interpretability: understanding why a model makes certain decisions can be difficult, especially with complex models like deep neural networks Scalability: building models that can handle large amounts of data and scale to production environments can be challenging Ethical considerations: ensuring that machine learning models are fair, unbiased, and respect privacy and security concerns
What are some popular machine learning libraries and frameworks?
There are many popular machine learning libraries and frameworks available, including: Scikit-learn: a library for classical machine learning in Python TensorFlow: an open-source framework for building and deploying deep learning models PyTorch: a popular deep learning framework developed by Facebook Keras: a high-level deep learning API that runs on top of TensorFlow and Theano XGBoost: a library for gradient boosting algorithms Apache Spark MLlib: a distributed machine learning library for big data processing
What is the difference between supervised and unsupervised learning?
Supervised learning is a type of machine learning where the model is trained on labeled data, meaning the target variable is known. The goal is to learn a function that maps inputs to outputs, such as predicting the price of a house based on its features. Unsupervised learning, on the other hand, is a type of machine learning where the model is trained on unlabeled data, meaning the target variable is unknown. The goal is to learn the underlying structure of the data, such as identifying clusters of similar data points or finding patterns in the data.
What is deep learning?
Deep learning is a subfield of machine learning that uses artificial neural networks, which are inspired by the structure and function of the human brain. Deep learning models are capable of learning from large amounts of data and can be used to solve complex problems such as image and speech recognition, natural language processing, and autonomous driving.
We use cookies to make our website a better place. Cookies help to provide a more personalized experience and web analytics. To learn more about the different cookies we're using, check out our Cookie Policy (baked goods not included). Read More
This website uses cookies to improve your experience while you navigate through the website. Out of these, the cookies that are categorized as necessary are stored on your browser as they are essential for the working of basic functionalities of the website. We also use third-party cookies that help us analyze and understand how you use this website. These cookies will be stored in your browser only with your consent. You also have the option to opt-out of these cookies. But opting out of some of these cookies may affect your browsing experience.
Necessary cookies are absolutely essential for the website to function properly. These cookies ensure basic functionalities and security features of the website, anonymously.
Cookie
Duration
Description
cookielawinfo-checkbox-analytics
11 months
This cookie is set by GDPR Cookie Consent plugin. The cookie is used to store the user consent for the cookies in the category "Analytics".
cookielawinfo-checkbox-functional
11 months
The cookie is set by GDPR cookie consent to record the user consent for the cookies in the category "Functional".
cookielawinfo-checkbox-necessary
11 months
This cookie is set by GDPR Cookie Consent plugin. The cookies is used to store the user consent for the cookies in the category "Necessary".
cookielawinfo-checkbox-others
11 months
This cookie is set by GDPR Cookie Consent plugin. The cookie is used to store the user consent for the cookies in the category "Other.
cookielawinfo-checkbox-performance
11 months
This cookie is set by GDPR Cookie Consent plugin. The cookie is used to store the user consent for the cookies in the category "Performance".
viewed_cookie_policy
11 months
The cookie is set by the GDPR Cookie Consent plugin and is used to store whether or not user has consented to the use of cookies. It does not store any personal data.
Functional cookies help to perform certain functionalities like sharing the content of the website on social media platforms, collect feedbacks, and other third-party features.
Performance cookies are used to understand and analyze the key performance indexes of the website which helps in delivering a better user experience for the visitors.
Analytical cookies are used to understand how visitors interact with the website. These cookies help provide information on metrics the number of visitors, bounce rate, traffic source, etc.
Cookie
Duration
Description
_ga
2 years
This cookie is installed by Google Analytics. The cookie is used to calculate visitor, session, campaign data and keep track of site usage for the site's analytics report. The cookies store information anonymously and assign a randomly generated number to identify unique visitors.
_ga_WLK0SPBG2G
2 years
This cookie is installed by Google Analytics. The cookie is used to calculate visitor, session, campaign data and keep track of site usage for the site's analytics report. The cookies store information anonymously and assign a randomly generated number to identify unique visitors.
Advertisement cookies are used to provide visitors with relevant ads and marketing campaigns. These cookies track visitors across websites and collect information to provide customized ads.


 Machine Learning Engineer Work Experience Certification Course ProgramProduct on sale₹69,999